More than 70% of researchers have tried and failed to reproduce another scientist’s experiments, and more than half have failed to reproduce their own experiments.
Monya Baker, 1,500 Scientists Lift the Lid on Reproducibility (2016)
2.1 Learning objectives
By the end of this chapter the reader should be able to:
Summarize the empirical evidence that a large fraction of published health-sciences research cannot be regenerated, and distinguish the studies that measure replication from those that measure computational re-execution.
State the distinction the National Academies draw between reproducibility and replicability, note that the wider literature adds robustness as a third term, and explain why the terminology is contested.
Explain why many re-execution failures are computational rather than statistical, using the silent-default changes in R as concrete cases.
Describe, in first outline, the stack of determinants beneath a computational result, and locate where in that stack a published script leaves the outcome unpinned.
Argue why reproducibility is a floor rather than a ceiling, and why a reproducible analysis can nonetheless be wrong.
2.2 Orientation
Consider a situation that every quantitative health scientist eventually meets. A biostatistician on a clinical-trial team runs the primary analysis, obtains the treatment effect and its confidence interval, exports the table that will anchor the regulatory submission, and files the script. Two years later, during an audit, an inspector asks that the analysis be regenerated from the archived code and data. On a fresh machine the script errors on the first library() call. Once the missing package is located and installed, the analysis runs. The point estimate has moved in the third decimal place, however, and one confidence interval no longer excludes the null. Nothing in the statistical reasoning was wrong. What failed was everything around the statistics: a package that changed beneath the code, a default that shifted between releases of R, a system library present on the first machine and absent on the second.
This book exists to prevent that failure, and this chapter establishes that the failure is real, common, and specifically computational. The stakes in a health science are not abstract. A result that cannot be regenerated cannot be audited. An analysis that a regulator cannot reproduce is an analysis a regulator may decline to trust. And a clinical recommendation built on a number that no one can recompute is a recommendation resting on faith rather than evidence. Reproducibility is, in the end, a precondition for the trust that clinical and public-health decisions require.
Throughout the book we place an analysis on a four-rung ladder, and we shall begin to use its vocabulary at once. An analysis is L0, locatable, when it is under version control and its source can be found, but nothing computational is pinned. It is L1, pinned packages, when the exact version of every package is fixed by a lockfile. It is L2, pinned environment, when the operating system, the language runtime, and the system libraries are fixed as well, usually inside a container. It is L3, verified, when the recorded computational outputs have been regenerated and shown to match. The auditor’s failure above is the failure of an analysis that reached, at best, L0: the code could be found, and nothing else about the computation had been fixed. The ladder is developed in full in Chapter 3; here we use it only to name what was missing.
2.3 The analyst’s contribution
Three judgments at the center of this chapter belong to the analyst and are automated by no tool.
Naming the failure mode. When a result will not regenerate, or regenerates differently, the analyst must decide whether the discrepancy is statistical (the method was inappropriate, the inference was misdrawn) or computational (the code is sound but its environment has shifted). The remedy differs entirely by case, and the diagnosis is a human act of judgment, not a mechanical one.
Matching the claim to the level reached. A reproducibility claim is a scientific claim and must be calibrated to evidence. The analyst decides, and states honestly, which rung of the ladder an analysis has actually reached, and resists the temptation to assert a level higher than the one secured.
Deciding what must be pinned. Not every determinant matters equally for every analysis. A simulation study lives or dies by its random-number configuration; a geospatial pipeline depends on system libraries that a survey analysis never touches. Judging which layers of the stack are load-bearing for the analysis at hand is a decision the analyst makes before any tool is invoked.
NoteThe vocabulary of this chapter
New to these terms? Each is defined again on first use.
Computational reproducibility. Obtaining the same numerical results from the same data and the same code, on another machine or at a later time.
Replicability. Obtaining consistent findings from a new study, with new data, aimed at the same question.
Robustness. Reaching the same qualitative conclusion from the same data under different but defensible analytical choices.
Determinant stack. The layered set of things a computational result depends on, from the hardware and operating system, through the system and numerical libraries, the language runtime, and the package versions, up to the session configuration and the code itself.
Silent default. A behavior that software applies unless told otherwise, and that can change between software versions without any error or warning to the analyst.
Seed and RNG kind. The seed (set.seed) is the fixed starting point that makes a random draw repeatable; the RNG kind is the generator algorithm that turns that seed into numbers, and its default has changed across R versions.
Package churn (code rot). The gradual breakage of once-working code as the packages beneath it are updated over time.
Research compendium. The self-describing bundle of code, data, and text that travels as the unit of a reproducible analysis, developed in
2.4 The evidence that re-execution fails
The case for taking reproducibility seriously is empirical, and it is not encouraging. We begin with the large replication studies, because they set the scale of the problem, and then turn to the narrower and, for our purposes, more damning studies that isolate the computational failures.
In psychology, the Open Science Collaboration re-ran one hundred published studies and could replicate the original finding in only thirty-nine of them (Open Science Collaboration, 2015). In preclinical oncology, Begley and Ellis, working from within industry, reported that only six of fifty-three landmark findings could be reproduced, a success rate close to one in ten (Begley & Ellis, 2012). These figures were not, at first, universally believed. But the suspicion that the published literature was less solid than it appeared already had a theoretical footing. Ioannidis had argued, given the prevailing rates of low statistical power, analytical flexibility, and publication bias, that most published research findings are false (Ioannidis, 2005). When Baker later surveyed more than fifteen hundred researchers for Nature, a majority agreed that science was facing a reproducibility crisis. More than seventy percent reported that they had tried and failed to reproduce another scientist’s experiments (Baker, 2016).
These are, for the most part, failures of replication, at the scientific end of a spectrum we shall shortly define, and their causes are many. But a growing body of work isolates the specifically computational failures. Here the question is not whether a finding holds up in a new sample, but merely whether the original analysis can be made to run a second time. Here the evidence is starker, because the failures are more avoidable. Trisovic and colleagues re-ran more than nine thousand R files deposited alongside published articles in the Harvard Dataverse. Roughly one in four executed without error, before any question of whether the output matched the published result (Trisovic et al., 2022). Saju and colleagues examined R code supplements archived on the Open Science Framework. They found that only about a quarter of the projects ran to completion, and that the great majority, close to ninety-nine percent, carried no formal description of their dependencies at all (Saju et al., 2025).
The distinction between the two bodies of evidence matters. The replication studies tell us that scientific findings are fragile. The re-execution studies tell us something more specific and more remediable, namely that a large fraction of published analyses cannot be regenerated even in principle. The reason is that the computational scaffolding needed to run them was never captured. It is the second failure, and not the first, that the tooling in this book addresses.
NoteCheck your understanding: two kinds of failure
A colleague re-runs the archived code from a published cohort study, obtains a number that differs from the printed one, and concludes that the paper’s finding does not replicate. Why is that conclusion premature, and which of the studies cited above speaks most directly to the colleague’s situation?
NoteAnswer
The colleague has demonstrated, at most, a failure of computational reproducibility: the same code and data did not regenerate the same number, most likely because the software environment shifted between the original run and this one. That is a statement about re-execution, not about whether the scientific finding holds in a new sample, which is what replication means. The situation is precisely the one that Trisovic and colleagues (Trisovic et al., 2022) measured at scale. Until the environment is reconstructed and the code is shown either to regenerate the original number or to contain a genuine error, no claim about replication is warranted.
2.5 Three words that are not synonyms
Before proceeding we must fix our terms, because the vocabulary of this field is genuinely contested and a reader who does not fix it will be confused by the literature. Goodman and colleagues surveyed the usage and found that the same words carry opposite meanings in different research communities, so that one field’s ‘reproducibility’ is another field’s ‘replication’ (Goodman et al., 2016). We adopt the distinctions of the National Academies, whose 2019 consensus report offers the settlement most widely followed in the health sciences (National Academies of Sciences, Engineering, and Medicine, 2019).
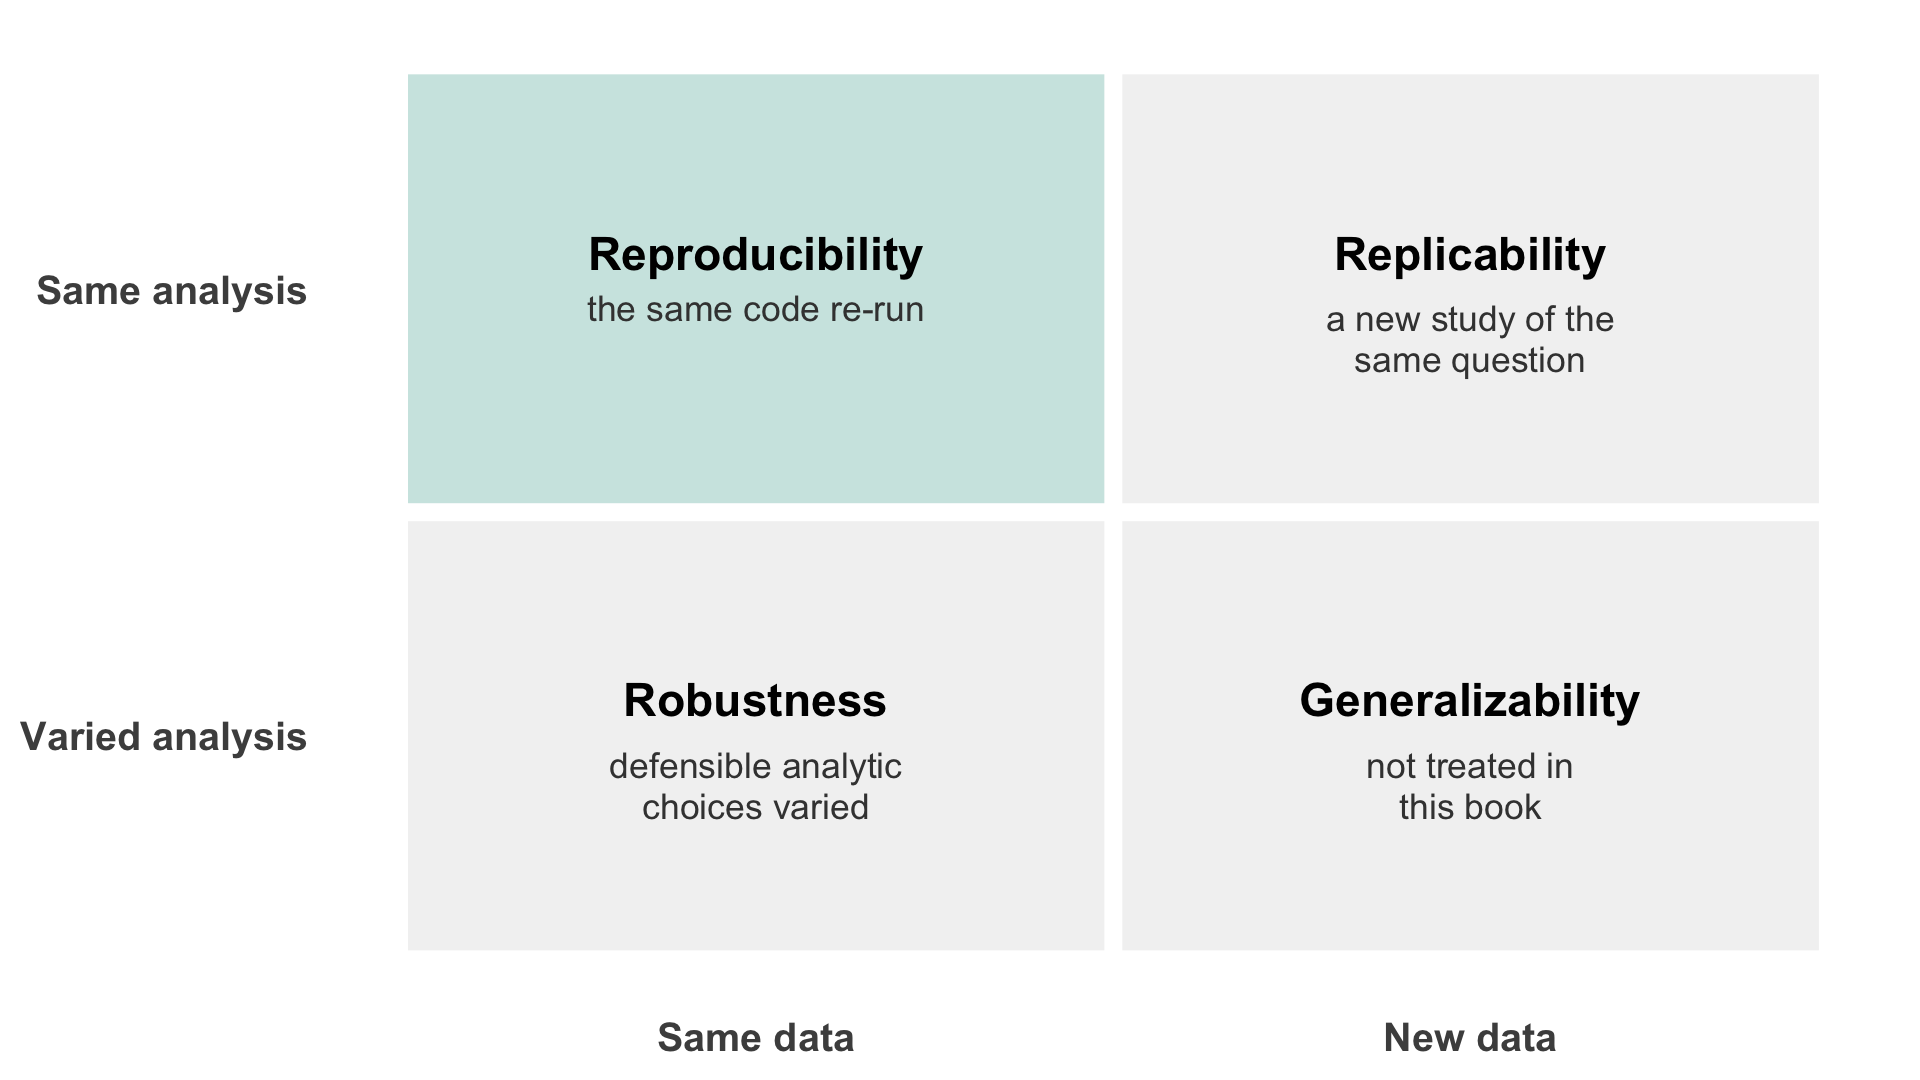
Reproducibility is obtaining consistent computational results using the same input data, the same computational steps, methods, and code, and the same conditions of analysis. It is a statement about re-execution, and it is the subject of this book. Replicability is obtaining consistent results across studies aimed at the same question, each collecting its own data. It is a statement about the durability of a scientific finding. To these two the report and the wider literature add a third, robustness, obtaining consistent conclusions from the same data when the analytical choices are varied within the range a competent analyst would defend. The three are independent. An analysis can be perfectly reproducible and entirely wrong, faithfully regenerating the same mistaken number on every machine. A finding can replicate across laboratories while no single analysis in the set is computationally reproducible. And a result can be reproducible yet fragile to a defensible change in model specification.
The three terms sort cleanly once one notices that they answer the same question about two different things: what was held fixed, the data or the analysis. Figure 2.1 lays the possibilities out as a grid, a presentation the Turing Way has made the common one (The Turing Way Community, 2022). The fourth cell, in which both the data and the analysis change, is generalizability, which this book names here for completeness and does not treat.
library(ggplot2)library(tibble)grid <-tibble(data =rep(c('Same data', 'New data'), each =2),analysis =rep(c('Same analysis', 'Varied analysis'), 2),term =c('Reproducibility','Robustness','Replicability','Generalizability'),gloss =c('the same code re-run','defensible analytic\nchoices varied','a new study of the\nsame question','not treated in\nthis book'),focus =c(TRUE, FALSE, FALSE, FALSE))grid$data <-factor(grid$data, levels =c('Same data', 'New data'))grid$analysis <-factor(grid$analysis,levels =c('Varied analysis', 'Same analysis'))ggplot(grid, aes(x = data, y = analysis)) +geom_tile(aes(fill = focus), color ='white', linewidth =2) +geom_text(aes(label = term), vjust =-0.6,fontface ='bold', size =3.9) +geom_text(aes(label = gloss), vjust =1.25, size =3,lineheight =0.95, color ='grey25') +scale_fill_manual(values =c('TRUE'='#cfe6e3','FALSE'='#f2f2f2'),guide ='none') +labs(x =NULL, y =NULL) +theme_minimal(base_size =10) +theme(panel.grid =element_blank(),axis.text =element_text(face ='bold', size =9.5) )
Figure 2.1: Reproducibility, replicability, and robustness distinguished by what is held fixed. The columns vary the data and the rows vary the analysis, so each cell names the claim supported when a consistent result survives that particular change. Only the shaded cell, in which both the data and the analysis are held fixed, is the subject of this book. The grid presentation follows the Turing Way (The Turing Way Community, 2022); the definitions are those of the National Academies (National Academies of Sciences, Engineering, and Medicine, 2019) adopted above.
The idea that computational work should be reproducible in the narrow, re-execution sense is older than the current crisis. It is usually traced to Claerbout and his colleagues in geophysics. In the early 1990s they built their published papers so that every figure could be regenerated from the archived code and data by a single command (Claerbout & Karrenbach, 1992). Their standard was demanding. The phrasing that has become the field’s motto is Buckheit and Donoho’s paraphrase of it (Buckheit & Donoho, 1995; Claerbout & Karrenbach, 1992): the published article is merely the advertisement of the scholarship, and the scholarship itself is the full computational apparatus that produced the figures.
Reproducibility so understood is not a single threshold but a spectrum. Peng arranged computational work along a scale, from the merely published, through code available, code and data available, and linked and executable, to fully replicable. He argued that reproducibility is a minimum standard for judging a scientific claim when full independent replication is impractical (Peng, 2011; Peng et al., 2006). The lesson we take from Peng, and develop into the levels ladder of Chapter 3, is that reproducibility comes in degrees. Honesty about which degree one has reached is itself a scientific virtue.
2.6 Why the failures are computational, not statistical
It is worth dwelling on why re-execution fails, because the reasons point directly at the remedy. Consider two changes to R itself, each silent, each an improvement, and each capable of altering a published result without any error or warning to announce it.
In R 3.6.0, released in 2019, the default algorithm that turns a seed into a random sample was corrected. The old sampler introduced a slight bias in sample(); the new one removed it. The consequence for reproducibility is direct. Code that set a seed and drew a sample obtained one sequence of draws before the release and a different sequence after it, with identical code and an identical seed (R Core Team, 2019). Every bootstrap, every cross-validation fold, every permutation test, and every simulation written under the old default draws differently under the new one. Then, in R 4.0.0, released in 2020, the stringsAsFactors default flipped from TRUE to FALSE. Reading a data frame now silently produced character columns where it once produced factors. This changed the behavior of any code that depended on factor-specific behavior, such as the ordering of levels or a function that requires a factor (R Core Team, 2020). Neither change was a bug; both were deliberate improvements. Both would nonetheless break the exact reproduction of an analysis written under the old default, and neither would say a word.
To these language-level shifts we must add the steadier erosion of package churn, the phenomenon by which working code rots as the packages beneath it are updated. A modern analysis may depend on dozens or hundreds of packages, each with its own release history and its own breaking changes. It is this churn that Trisovic and colleagues measured when they found that most deposited R scripts ceased to run within a few years (Trisovic et al., 2022). The code did not change; its dependencies did.
These are instances of a general phenomenon that we shall develop fully in Chapter 3. A computational result depends not only on the code and the data but on a stack of determinants beneath them: the operating system and its system libraries, the numerical libraries that implement linear algebra, the language runtime, the exact versions of every package, the session configuration (the random-number kind, the contrasts, the number of printed digits, the locale and time zone), and, underneath all of it, the hardware. A published script pins almost none of these. It records the analysis logic and, if the reader is fortunate, the data, and leaves the remaining layers to whatever the next machine happens to provide. Reproducibility fails in the gap between what the script fixes and what the result depends on. The organizing question of this book is how far down that stack a given effort has actually reached.
This diagnosis, that the failures are computational rather than statistical, is what makes the problem tractable. A statistical error requires a scientific judgment to correct; a computational failure requires only that the determinant stack be captured, layer by layer, so that the same computation can be run again. The crisis is not, at bottom, a shortage of statistical competence. It is a shortage of computational hygiene, and hygiene can be taught, tooled, and enforced.
The point applies to every kind of computational output, not only to the polished manuscript. A research compendium comes in several archetypes, developed in full in 1: a data-analysis project, a scholarly manuscript, an R package, a simulation study, and a blog of many rendered posts. Each varies the directory layout, whether a rendered report exists at all, and which validation gates apply. But all share the same determinant stack, and so are exposed to the same silent shifts. An R package with no report to render can still be broken by a changed sample.kind. A simulation study, whose whole output is a set of random draws, is more exposed to the RNG change than any manuscript. And a teaching blog that renders forty posts inherits the churn of every package any post loads. The discipline that follows applies across all of them.
NoteCheck your understanding: locating the failure
An analyst reports that a script producing a principal-components plot gives visibly different loadings on a colleague’s laptop, although both installed the same package versions from the same lockfile. Setting a seed changes nothing. Which layer of the determinant stack is the most likely culprit, and why does the lockfile not protect against it?
NoteAnswer
The most likely culprit is the numerical-library layer, specifically the BLAS and LAPACK implementation that performs the eigendecomposition underlying prcomp(). Different implementations (reference BLAS, OpenBLAS, Intel MKL, Apple’s Accelerate) return results that are numerically equivalent but not bit-identical, and a sign flip or reordering of components can make the difference visible in a plot. A lockfile pins the R packages but says nothing about the system libraries the packages link against. Those live below the package layer, at L2 rather than L1, and are fixed only by controlling the environment itself, the subject of Chapter 7. Setting a seed does not help because the difference is not stochastic.
2.7 A reproducible analysis can still be wrong
We must guard against a misreading that the foregoing invites. Nothing in this book claims that a reproducible analysis is a correct one. The point is pressed by Leek and Peng, who observe that reproducibility guarantees only that a computation can be regenerated, not that the computation was the right one to perform (Leek & Peng, 2015). A script that faithfully regenerates a mistaken p-value on every machine, forever, is perfectly reproducible and perfectly wrong. Reproducibility disciplines the computation; it does not discipline the science.
It follows that reproducibility is a floor and not a ceiling. It is the minimum standard beneath which a computational claim cannot be assessed at all, because a result no one can regenerate is a result no one can check. Above that floor sit all the harder questions, of study design, of confounding, of model choice, of inference, that reproducibility does not touch. We insist on the floor precisely so that the harder questions become answerable: an analysis that can be re-run is an analysis whose statistical choices can be inspected, criticized, and, where necessary, corrected.
ImportantThe honest level
A reproducibility claim is a scientific claim and must be matched to the level actually reached, never asserted above it. To say that an analysis is reproducible when the code merely exists in a repository (L0) is to claim L3 while having secured L0 only. The gap will be discovered at exactly the moment, an audit, a revision, a replication attempt, when it is most costly. State the rung you have reached, and no higher.
2.8 Worked example
To make the RNG change concrete rather than anecdotal, we reproduce it here in a few lines of base R. The generator that turns a seed into a sample is selectable through RNGkind(), and R still ships both the pre-3.6.0 sampler, named Rounding, and the current one, named Rejection. We can therefore hold the seed fixed at a single value, vary only the sampler, and observe directly that the same seed does not give the same draws when the RNG kind differs. The function below sets the sampler, sets the seed, and shuffles the integers one through ten. We call it under each sampler and restore the session’s original generator afterward, so that nothing downstream is disturbed.
Table 2.1: The same seed yields the same draws only under the same RNG kind. Each row shows the first six values of a shuffled sequence of the integers one through ten, drawn under seed 123.
RNG sample kind
First six draws
Rounding (R < 3.6.0)
3, 8, 4, 7, 6, 1
Rejection (R >= 3.6.0)
3, 10, 2, 8, 6, 9
The two rows of Table 2.1 share a seed and share a line of code, set.seed(123); sample(1:10), and yet they diverge almost immediately, coinciding only sporadically thereafter. An analyst who set a seed under R 3.5, confident that the seed made the analysis reproducible, would find the draws silently changed on upgrading to R 3.6 or later. The seed was never the whole story; the seed together with the RNG kind is. This is the determinant stack in miniature: the code fixed one layer, the seed, and left another, the sampler, to whatever the running version of R supplied. Pinning the R version, which we reach at L2 with a container, is what closes this particular gap. Recording the RNG kind in the session configuration, meanwhile, is what makes the gap visible in the interim.
2.9 Collaborating with an LLM
A large language model is a capable assistant for the material of this chapter, provided the analyst treats its output as a draft to be verified rather than an authority to be trusted. Three uses recur, and each carries a specific verification burden.
Prompt. ‘Explain the difference between reproducibility, replicability, and robustness, and give a health-sciences example of each.’
Watch for. Models frequently conflate the first two terms, or adopt the reversed convention that some fields use, because both usages are well represented in their training data. The example offered may be plausible-sounding but mislabelled.
Verification. Check the definitions against the National Academies framing (National Academies of Sciences, Engineering, and Medicine, 2019) adopted in this chapter, and confirm that the example labeled ‘reproducibility’ concerns re-executing the same code on the same data, not re-collecting data. Do not accept the term assignment without this check.
Prompt. ‘My results changed after I upgraded R. What could have caused this and how do I diagnose it?’
Watch for. The model may propose confident but untested causes, or invent version numbers and release dates for the change it blames. It has no access to your session and cannot know which layer actually moved.
Verification. Treat every proposed cause as a hypothesis to test against your own sessionInfo() and the actual release notes, not as a diagnosis. Confirm the specific mechanism (for the RNG change, by the demonstration above; for stringsAsFactors, by inspecting a column’s class) before acting on it.
Prompt. ‘Write a paragraph for my methods section stating that my analysis is fully reproducible.’
Watch for. The model will happily assert a level of reproducibility that your project has not reached, because it is completing a pattern, not auditing your compendium. A confident claim of full reproducibility is exactly the overstatement the honest-level caution warns against.
Verification. Establish which rung of the ladder the analysis has genuinely reached, and edit the paragraph to claim that rung and no higher. The claim is your responsibility, not the model’s.
2.10 Exercises
Locate a published article in your own field that provides code and data. Attempt to run the code on your machine without modification. Record what happened at each step, and classify any failure you meet as computational or statistical. On which rung of the ladder (L0 to L3) would you place the deposited analysis, and why?
The chapter distinguishes reproducibility, replicability, and robustness. For a study you know well, write one sentence describing what it would mean for that study to fail on each of the three dimensions separately. Which failure would be most damaging to the study’s clinical conclusion?
Modify the worked-example chunk to draw a bootstrap resample of a small synthetic vector rather than a shuffle, again comparing the two RNG kinds under a fixed seed. Does the choice of sampler still change the result? Explain what this implies for a bootstrap confidence interval computed under the two R versions.
Consider the archetypes named in the chapter (a data-analysis project, a manuscript, an R package, a simulation study, and a blog). For each, state which single determinant you would expect to be most load-bearing for its reproducibility, and justify the choice in one sentence.
Reproducibility is described as a floor rather than a ceiling. Construct a short, concrete example of an analysis that is fully reproducible (L3) and yet scientifically wrong, and explain what a reader would need beyond reproducibility to detect the error.
Read the abstract of the Open Science Collaboration report (Open Science Collaboration, 2015) and of the Trisovic study (Trisovic et al., 2022). In two or three sentences, explain why the two papers measure different things, and which one is the more relevant evidence for the argument of this book.
2.11 Solutions
Attempt an exercise before expanding its solution. Several exercises in this chapter ask the reader to work with an article or a study of their own choosing, so they have no single correct answer. For those the box says what a good answer establishes, and names the failure modes worth looking for.
NoteExercise 1
No single correct answer, since it depends on the article chosen. What a good answer establishes is a classification and a placement, both defended.
On the classification, the discipline is to ask what kind of thing went wrong. A missing package, a package that installs but at a newer version, a hard-coded path, a file that was never deposited, a script that assumes a working directory: these are computational failures, and they are the ones this book addresses. A number that regenerates exactly but that you believe was the wrong number to compute is a statistical disagreement, and no amount of environment capture touches it. Most readers find that their failures are overwhelmingly of the first kind, which is the point of the exercise and matches what Trisovic and colleagues measured at scale (Trisovic et al., 2022).
On the placement, the honest default for a deposited analysis is L0. Code and data that can be located and downloaded are locatable, and that is what most deposits supply. A deposit that also carries a lockfile is L1; one carrying a container recipe is L2; one carrying evidence that the outputs were regenerated is L3. Note that the rung is set by what the authors deposited, not by whether the code happened to run on your machine. An analysis can be L0 and still run, because you were lucky, and it can be L1 and still fail, because the lockfile pinned packages and something below them moved.
NoteExercise 2
No single correct answer, since it depends on the study. What a good answer establishes is that the three dimensions are independent, which is easiest to see by writing three sentences that could each be true while the other two are false.
A serviceable template. Reproducibility fails if a reader with the authors’ own data and code cannot regenerate the published numbers. Replicability fails if a new cohort, collecting its own data to answer the same question, does not find the effect. Robustness fails if the effect disappears when a competent analyst makes a different but defensible modeling choice, a different adjustment set, a different handling of missing data, a different cut point.
On which failure is most damaging to the clinical conclusion, the defensible answer is replication, and the reasoning matters more than the answer. A reproducibility failure impugns the record but leaves open whether the finding is true. A robustness failure shows the finding depends on a choice, which weakens it without refuting it. A replication failure is evidence that the effect is not there. A reader who argues instead that reproducibility is most damaging, on the grounds that it undermines the ability to evaluate the other two at all, has made a reasonable case and should say so explicitly.
NoteExercise 3
Yes, the choice of sampler still changes the result, and for the same reason as in the worked example. Both sample(1:10) and a bootstrap resample, sample(x, replace = TRUE), obtain their randomness by drawing from the same underlying generator, so a change of sample.kind changes the index sequence and therefore the resample. Substituting sample(x, length(x), replace = TRUE) for the shuffle in draw_sample() and calling it under Rounding and Rejection at seed 123 produces two different resamples.
The implication for a bootstrap confidence interval is the substantive part of the exercise. The interval is a function of the resamples, so two R versions straddling 3.6.0 produce different intervals from the same seed, the same data, and the same code. The difference is small when the number of replicates is large, since both intervals estimate the same quantity and the Monte Carlo error shrinks, but it is not zero, and it is enough to move a reported bound in its last printed digits. If a published interval is quoted as excluding the null by a narrow margin, a rerun under the other sampler can move it across that boundary.
The lesson to draw is that a seed is not a sufficient record of a stochastic analysis. The seed pins the starting point, but the RNG kind determines what the generator does with it, and the RNG kind is a session configuration that neither a lockfile nor a container necessarily fixes. An analysis that depends on a bootstrap should record RNGkind() alongside the seed, or set it explicitly.
NoteExercise 4
Answers will vary in their justification, and more than one choice is defensible for each archetype. What a good answer establishes is that the archetypes stress different layers, so a single reproducibility recipe serves them unevenly.
A defensible set. For a data-analysis project, the data itself, since the analysis is worthless without the extract it ran on and that extract is often the artifact least likely to travel. For a manuscript, the rendering toolchain, since the deliverable is a document and the numbers in it must be regenerated rather than retyped. For an R package, the declared dependency set, since the package is consumed by other code and its correctness is a claim about behavior under a stated environment. For a simulation study, the random-number discipline, since the entire output is a function of the seed and the generator, as this chapter’s worked example shows. For a blog, the pinned package versions, since posts are written once and read for years while the packages beneath them move.
A reader who answers ‘the data’ for every archetype has not made an error so much as missed the exercise, which is to notice that the binding constraint moves.
NoteExercise 5
Answers will vary. What a good answer establishes is that reproducibility is a property of re-execution and carries no claim about correctness.
A clean construction: a cohort analysis computes thirty-day readmission but the cohort was defined with an off-by-one error in the date window, so patients readmitted on day thirty are excluded. The analysis is containerized, its packages pinned, its outputs verified against recorded hashes, and it regenerates the same number on every machine and every rerun. It is L3. It is also wrong, and it will remain wrong, identically, for as long as anyone runs it. Other serviceable examples are a sign error in a contrast, a covariate adjusted for that sits on the causal pathway, and a survival analysis that treats censoring as an event.
What a reader needs beyond reproducibility to detect the error is subject-matter review of the code and the design: someone who knows what thirty-day readmission means reading the cohort definition, or a unit test asserting the boundary case against a hand-computed answer. This is the point at which Chapter 11 takes over from environment capture, and it is why the book treats validation as a separate register from capture. Note the uncomfortable corollary: reproducibility makes an error easier to find once someone suspects it, and does nothing to make anyone suspect it.
NoteExercise 6
The two papers measure different things because they address two of the three words this chapter separates.
The Open Science Collaboration ran new studies collecting new data, and asked whether the original findings held (Open Science Collaboration, 2015). That is replication: a statement about the durability of the science. Trisovic and colleagues took deposited code and data and asked whether it would execute at all (Trisovic et al., 2022). That is reproducibility in the narrow sense: a statement about re-execution, in which the science is not in question because it never got as far as being evaluated.
For the argument of this book, Trisovic is the more relevant evidence, and it is worth being explicit about why, since the replication literature is the more famous. This book is about the computational floor. It has nothing to say about whether an effect is real, and its whole claim is that a large fraction of deposited analyses cannot be re-executed, which is a problem soluble by engineering rather than by more studies. The Open Science Collaboration measures a problem this book does not address and cannot fix.
The stronger version of the answer notes that the two are not independent in practice: a field that cannot re-execute its own analyses cannot easily diagnose why a replication failed, because it cannot establish what the original analysis actually did.
2.12 Further reading
The National Academies consensus report (National Academies of Sciences, Engineering, and Medicine, 2019) is the authoritative source for the reproducibility, replicability, and robustness distinctions, and repays reading in full for the care with which it separates them.
Goodman and colleagues (Goodman et al., 2016) document the terminological confusion directly and propose a cleaner lexicon; read it to understand why the same words mean opposite things across fields.
Peng’s short article (Peng, 2011), together with his earlier treatment (Peng et al., 2006), is the origin of the spectrum idea that becomes the levels ladder of Chapter 3, and states the case for reproducibility as a minimum standard.
For the empirical scale of the problem, the Open Science Collaboration report (Open Science Collaboration, 2015) and Begley and Ellis (Begley & Ellis, 2012) establish the replication failures, while Trisovic and colleagues (Trisovic et al., 2022) and Saju and colleagues (Saju et al., 2025) isolate the computational ones. Baker’s Nature survey (Baker, 2016) captures how researchers themselves perceive the crisis, and Ioannidis (Ioannidis, 2005) supplies the theoretical argument that anticipated it.
On the load-bearing caveat that reproducibility is a floor and not a ceiling, Leek and Peng (Leek & Peng, 2015) are brief, pointed, and worth reading before one is tempted to equate a reproducible result with a correct one.
For the historical origin of the ideal, Claerbout’s work in reproducible geophysics (Claerbout & Karrenbach, 1992) is the standard reference for where the modern practice begins.
Baker, M. (2016). 1,500 scientists lift the lid on reproducibility. Nature, 533(7604), 452–454. https://doi.org/10.1038/533452a
Begley, C. G., & Ellis, L. M. (2012). Raise standards for preclinical cancer research. Nature, 483(7391), 531–533. https://doi.org/10.1038/483531a
Claerbout, J. F., & Karrenbach, M. (1992). Electronic documents give reproducible research a new meaning. SEG Technical Program Expanded Abstracts 1992, 601–604. https://doi.org/10.1190/1.1822162
Goodman, S. N., Fanelli, D., & Ioannidis, J. P. A. (2016). What does research reproducibility mean? Science Translational Medicine, 8(341), 341ps12. https://doi.org/10.1126/scitranslmed.aaf5027
Leek, J. T., & Peng, R. D. (2015). Reproducible research can still be wrong: Adopting a prevention approach. Proceedings of the National Academy of Sciences, 112(6), 1645–1646. https://doi.org/10.1073/pnas.1421412111
National Academies of Sciences, Engineering, and Medicine. (2019). Reproducibility and replicability in science. The National Academies Press. https://doi.org/10.17226/25303
Open Science Collaboration. (2015). Estimating the reproducibility of psychological science. Science, 349(6251), aac4716. https://doi.org/10.1126/science.aac4716
Peng, R. D., Dominici, F., & Zeger, S. L. (2006). Reproducible epidemiologic research. American Journal of Epidemiology, 163(9), 783–789. https://doi.org/10.1093/aje/kwj093
R Core Team. (2019). R: A language and environment for statistical computing. R Foundation for Statistical Computing. https://www.R-project.org/
R Core Team. (2020). R: A language and environment for statistical computing. R Foundation for Statistical Computing. https://www.R-project.org/
Saju, L. et al. (2025). Computational reproducibility of R code supplements on OSF. arXiv Preprint arXiv:2505.21590. https://arxiv.org/abs/2505.21590
The Turing Way Community. (2022). The TuringWay: A handbook for reproducible, ethical and collaborative research. Zenodo. https://doi.org/10.5281/zenodo.3233853
Trisovic, A., Lau, M. K., Pasquier, T., & Crosas, M. (2022). A large-scale study on research code quality and execution. Scientific Data, 9(1), 60. https://doi.org/10.1038/s41597-022-01143-6