Draft. This book is under active development, and chapters may change. Please use ‘Report an issue’ to flag problems.
10Automating the Analysis: Make and targets
Avoid Manual Data Manipulation Steps.
Sandve, Nekrutenko, Taylor, and Hovig, Ten Simple Rules for Reproducible Computational Research, Rule 2 (2013)
This chapter concerns the multi-step analysis that someone runs by hand, script after script. By its end you will be able to replace the running of such an analysis with a single command whose completeness does not depend on anyone’s memory. That command rests on a dependency graph that a tool, not an analyst, walks to decide what has gone stale and what has not.
NoteBefore you start
Reading time. About 55 minutes.
Prerequisites. The determinant stack and the capture-versus-validation distinction of Chapter 3 (Chapter 3). This chapter’s central claim, that a pipeline validates re-execution without capturing any new layer, is stated entirely in those terms. The sealed, reproducible render of Chapter 9 (Chapter 9). A pipeline is what a growing analysis needs once some of its computation has moved out of that single document and into scripts. Comfort writing an R function with explicit arguments and a return value, reading a short shell command, and no prior exposure to Make, targets, or any other build tool. In the one-quarter core path (see the Conventions page), only the Make section below is core. The targets, Snakemake, Nextflow, and workflowr sections that follow it are marked optional, and they can be skipped on that schedule without losing the chapter’s central claim.
By the end of this chapter you will be able to answer:
Can you diagnose the failure mode of a manually run, multi-step analysis: steps run out of order, an upstream change leaves a downstream output stale, and no one can be sure the whole thing still runs end to end from raw data to report?
Can you express an analysis as a directed acyclic graph of steps, and explain why a single command can then rebuild exactly what is out of date and nothing more?
Can you read and write a GNU Make rule, its target, prerequisites, and recipe, explain the timestamp-based staleness check, and say why Make’s reach is language-agnostic?
Can you build an R-native, function-oriented pipeline with targets, including _targets.R, tar_target(), tar_make(), and tar_visnetwork(), and explain how targets invalidates exactly the targets that depend on a changed function, object, or package?
Can you state, in the book’s capture-versus-validation terms, precisely what a pipeline does and does not add to the reproducibility ladder, and judge how heavily the pipeline machinery bears on each research archetype?
Outline.
Where this sits on the stack: a pipeline validates, it does not capture.
Orientation: a report stale behind a corrected dataset.
The analyst’s contribution: granularity, honest dependency declarations, and the level a pipeline does not establish.
The analysis as a dependency graph: the DAG, and its cost measured rather than asserted.
GNU Make: targets, prerequisites, rules, and the timestamp check.
targets: a function-oriented pipeline that hashes code and objects, not just file times.
What a pipeline does, and does not, add to the ladder.
Pipelines across the archetypes.
Beyond R: Snakemake, Nextflow, and workflowr.
Worked example: refactoring four scripts into a targets pipeline.
The cohort, continued: the compendium’s own two-step graph, timed.
A language model inside the pipeline: a dependency no rung pins, and its responses kept as data.
NoteCheck your understanding: from earlier chapters
A collaborator updates survival to a newer release and commits the new renv.lock. You pull the commit, run renv::restore(), and render the whole Quarto project, whose _quarto.yml sets freeze: auto. The hazard ratio on the page is unchanged, under a fresh build date. Drawing on Chapter 6 and Chapter 9, which determinant layer changed, can the page tell you whether the new release moved the estimate, and what render would?
NoteAnswer
The layer that changed after the survival update is the package-versions layer. The new renv.lock records the newer release, and renv::restore() reinstalls exactly the versions the lockfile records (Chapter 6). The page cannot tell you whether the estimate moved. Under freeze: auto, a project render compares only with the document’s own source, so an updated package leaves the frozen results in _freeze/ in place under a fresh build date (Section 9.8). Rendering that single document always executes its code. For a deposited analysis, render in the pinned environment with freeze off, or after deleting _freeze/ and the cache directories (Chapter 9).
10.1 Where this sits on the stack
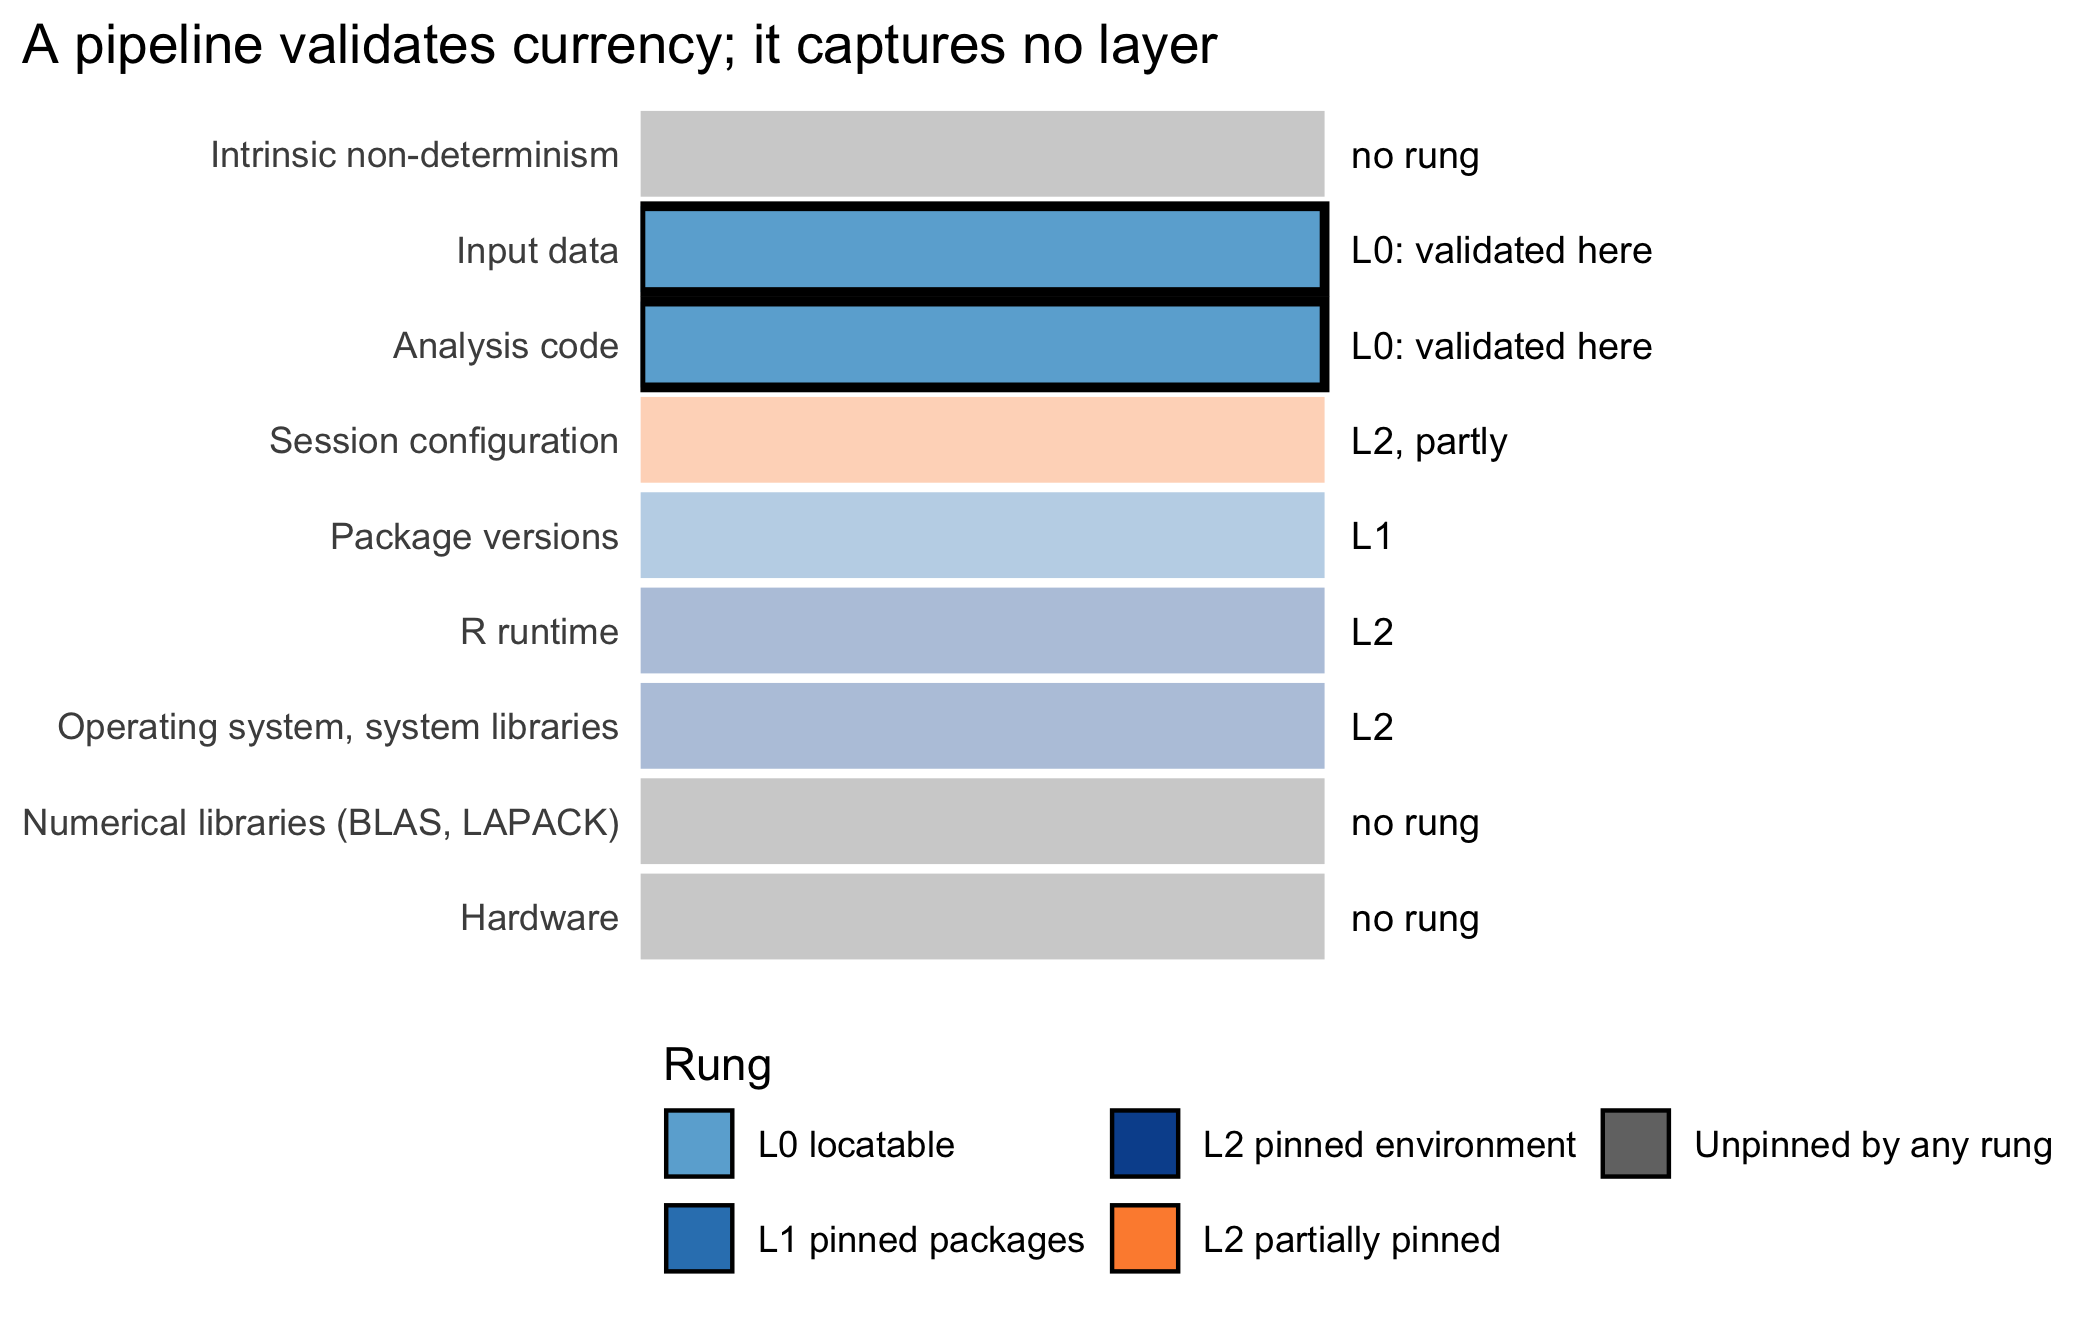
We begin by locating the chapter on the determinant stack. Its claim is the sharpest negative result in the book so far: the pipeline tools it teaches pin no new determinant at all. They do not fix a package version, and they do not fix an operating system or an R runtime; that is the work of Chapter 6 and Chapter 7. What a pipeline does is confirm, mechanically and on every run, that the recorded analysis code and the input data currently in hand are the ones a given output reflects. We therefore mark, in Figure 10.1, the analysis-code and input-data layers as validated here, not captured. This is the same reading Chapter 11 gives its own test suite for the same two layers, though by a different mechanism: a test suite checks that the code is correct on some input, where a pipeline checks only that an output is current with respect to whatever input it was last given, correct or not.
plot_determinant_stack( validates =c('Analysis code', 'Input data'), title ='A pipeline validates currency; it captures no layer')
Figure 10.1: The determinant stack of Chapter 3, with the analysis-code and input-data layers marked as validated, not captured, by a pipeline tool. Make and targets confirm that a recorded output is current with respect to the code and data that produced it; they do not pin a package version, an operating system, or an R runtime, and they say nothing about whether the code or the data are correct, only whether the output in hand still reflects them.
NoteCheck your understanding: capture or validation, again
A colleague argues that adding a _targets.R pipeline to a project must raise its reproducibility level, since the project can now be rebuilt with one command instead of several remembered ones. Using this chapter’s stack figure, is the colleague correct?
NoteAnswer
No. The pipeline pins no layer of the determinant stack: the package versions, the operating system, and the R runtime are exactly as pinned, or as unpinned, after _targets.R is added as before. What changed is that the analysis-code and input-data layers are now checked for currency on every run rather than trusted to memory. That is a validation feature, like continuous integration or a baseline test, and it leaves the project’s rung on the L0 to L3 ladder exactly where it was.
10.2 Orientation
Consider an analysis that has grown, as most do, one step at a time. There is a script that reads the raw export and writes a cleaned dataset. A second fits a model to the cleaned data and saves the fitted object. A third draws the figures from the model, and a report assembles the figures and the tables into a manuscript. Each script runs, and the analyst runs them in order, by hand, at the console. For a while this works.
The trouble begins when the raw data are corrected. The analyst re-runs the cleaning script, and now must remember three further things. The model depends on the cleaned data and must be re-run; the figures depend on the model and must be re-run; and the report depends on the figures and must be re-rendered. Each of these is a separate act of memory. Miss one, and the report now shows a figure drawn from the old model, fitted to the old data, and nothing in the document announces the discrepancy. The output is stale: it is downstream of a change that never propagated to it. Worse, the staleness is invisible, because a stale figure is a perfectly valid PNG file that opens and displays without complaint.
This is the failure this chapter exists to prevent, and it has three faces. The first is order. The steps have a required sequence, cleaning before modeling before plotting, and running them out of order produces either an error or, more dangerously, a result computed from the wrong inputs. The second is staleness. A change to an upstream file leaves every downstream output obsolete, and re-propagating the change by hand is exactly the kind of bookkeeping a human does poorly. The third is the end-to-end doubt. After a session of editing scripts and re-running some of them, the analyst cannot honestly say whether the whole analysis still runs from raw data to finished report. It has been weeks since anyone ran it all, in order, in one act. The project works, in the sense that its outputs exist, but no one can be sure it would work if rebuilt from nothing.
How, then, are we to remove memory from the process? The remedy is to stop treating the analysis as a remembered sequence of commands and to express it instead as a structure. That structure is a graph of steps, each declaring what it consumes and what it produces. From it a machine can work out the order, detect the staleness, and re-run exactly what a change requires. Such a structure is a pipeline, and this chapter is about two tools that build one, the venerable and language-agnostic GNU Make and the R-native targets. The manual-steps critique that motivates them is stated crisply in the practices literature. Sandve et al. (2013), in their second rule, urge that one ‘avoid manual data manipulation steps’ and automate the path from raw data to result. Their reason is that a manual path cannot be trusted to have been followed the same way twice.
NoteCheck your understanding: naming the failure
An analyst corrects a typo in the raw data, re-runs the modeling script because that is the step they are thinking about, and ships the resulting report. The figures were drawn from the model fitted before the correction. Which of the orientation’s three faces, order, staleness, or end-to-end doubt, does this failure illustrate, and why does the stale figure give no warning?
NoteAnswer
It is staleness. The correction to the raw data left the figures, which depend on the model fitted from the old data, out of date. Re-running only the modeling script did not propagate the change the one additional step further. The stale figure gives no warning because a stale PNG is a perfectly valid image file. Nothing about its bytes records what it was computed from, so neither the file system nor a glance at the document can distinguish it from a current one.
10.3 The analyst’s contribution
Three judgments in this chapter are the analyst’s own, and no pipeline tool makes them.
Deciding where the steps divide. A pipeline is a graph of steps, and the analyst chooses what a step is. That is, the analyst decides how finely to cut the analysis into targets, which computations to group and which to separate. Cut too coarsely, into one enormous step, and the pipeline caches nothing useful, because any change re-runs everything. Cut too finely, into hundreds of trivial targets, and the graph becomes hard to read and the bookkeeping overhead dominates. The right granularity puts the expensive, stable computations, a model fit, a simulation run, in targets of their own, so that a change elsewhere does not needlessly re-run them. The choice trades caching benefit against graph legibility.
Keeping the dependency declarations honest. A pipeline can only track dependencies it is told about, or can infer. Make infers nothing. Every prerequisite an analyst omits from a rule is a dependency the tool cannot see, and an omitted prerequisite is exactly how a stale output slips through. targets infers a great deal automatically, but it too can be defeated, by a step that reads a file without declaring it as a file target, or that reaches for global state the tool cannot trace. Getting the declared dependencies to match the real ones is the analyst’s responsibility, and a pipeline’s correctness rests on it.
Matching the claim to what a pipeline delivers. A pipeline mechanizes re-execution. It does not pin a package, fix an environment, or establish that a result is correct. An analyst who says ‘the analysis is reproducible’ because tar_make() runs to completion has claimed more than the pipeline delivers. This is the same overreach, for the same reasons, as treating the sealed render of Chapter 9 as a reproducibility guarantee. The pipeline secures the act of re-running. The level reached is a separate question, settled by the lockfile, the container, and the verification of the later chapters.
NoteCheck your understanding: whose judgment, again
A targets pipeline runs green, end to end, on the analyst’s machine. Which of the three judgments above, if any, has the green run settled, and which remain open?
NoteAnswer
A green run settles none of the three. It says nothing about whether the targets were cut at a sensible granularity, since a pipeline with one enormous target can run green and still cache nothing useful. It says nothing about whether the declared dependencies are complete, since an undeclared input simply never triggers a rebuild and the run stays green regardless. And it says nothing about the level reached, since re-execution and pinning are different questions entirely.
NoteThe vocabulary of this chapter
Pipeline. An analysis expressed as a set of steps, each declaring its inputs and outputs, so that the whole can be re-executed by a single command that runs the steps in dependency order.
Dependency graph. The graph whose nodes are the steps and whose edges record that one step consumes what another produces. A valid pipeline’s graph is a directed acyclic graph (DAG): directed because inputs flow to outputs, and acyclic because a step cannot, directly or transitively, depend on its own output.
Target. A single step in the pipeline, together with the output it produces. The word is shared by Make and targets, with a shift of emphasis: for Make a target is a file, for targets it is more often an R object.
Prerequisite. In Make, an input a target depends on. If any prerequisite is newer than the target, the target is out of date.
Recipe (or command). The shell command Make runs to bring a target up to date from its prerequisites.
Staleness (out-of-date). The condition of a target whose inputs have changed since it was last built, so that its stored output no longer reflects its inputs.
Up-to-date (skippable). The condition of a target whose inputs have not changed since it was last built, so that rebuilding it would reproduce the stored output and can be skipped.
Invalidation. The act of marking a target out of date because something it depends on, a file, an upstream target, a function, or a package, has changed.
10.4 The analysis as a dependency graph
Having named the failure, we now turn to the structure that prevents it. The conceptual move that a pipeline asks of an analyst is to stop thinking of the analysis as a list of commands to run. Instead, the analyst thinks of it as a graph of dependencies to satisfy. The two descriptions contain the same steps, but they license different machinery. A list of commands can only be replayed, from the top, every time. A graph of dependencies can be interrogated, so that a tool can answer the question a list cannot: which steps actually need to run now, given what has changed?
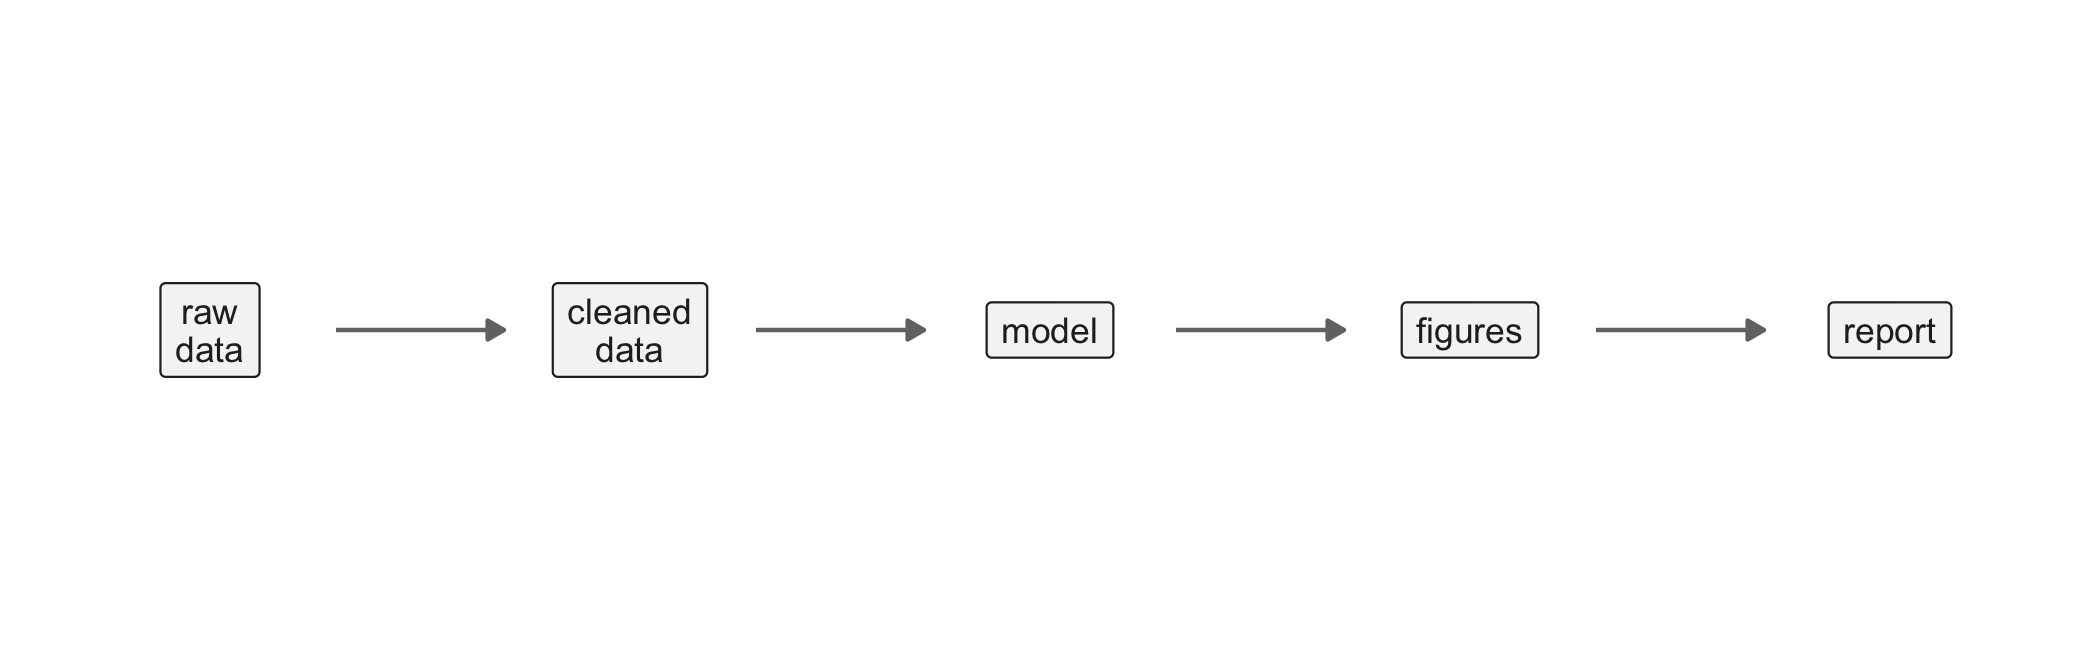
Figure 10.2 draws the graph for the small analysis of the orientation. Each node is a step that produces an output, and each arrow records that the step at its head consumes what the step at its tail produces. The graph is directed, because the flow from raw data to report has a direction, and it is acyclic, because no output feeds, however remotely, back into its own inputs. This is the directed acyclic graph, the DAG, that every pipeline tool builds internally, whether or not it draws it for the reader.
library(tibble)library(ggplot2)nodes<-tibble( step =c('raw\ndata', 'cleaned\ndata', 'model','figures', 'report'), x =1:5, y =0)edges<-tibble( x =1:4, xend =2:5, y =0, yend =0)ggplot()+geom_segment( data =edges,aes(x =x+0.30, xend =xend-0.30, y =y, yend =yend), arrow =grid::arrow(length =grid::unit(0.16, 'cm'), type ='closed'), linewidth =0.5, colour ='grey45')+geom_label( data =nodes,aes(x =x, y =y, label =step), size =3, lineheight =0.9, label.padding =grid::unit(0.35, 'lines'), label.r =grid::unit(0.12, 'lines'), fill ='grey96', colour ='grey15')+coord_cartesian(xlim =c(0.5, 5.5), ylim =c(-1, 1), expand =FALSE)+theme_void()
Figure 10.2: The analysis of the orientation as a directed acyclic graph. Each node is a step that produces an output; each arrow records that the step it points to consumes what the previous step produced. A change to the raw data invalidates every node downstream of it (all four to its right); a change to the plotting code invalidates only the figures and the report. A pipeline tool reads this graph to rebuild exactly the stale nodes and skip the rest.
Two operations on this graph are the whole point of a pipeline. The first is the topological sort. Reading the arrows, the tool can order the steps so that no step runs before the steps it depends on. This is the order the analyst was keeping in their head and now need not. The second is selective rebuild. Given a record of what each step last consumed, the tool can mark a step stale when any of its inputs has changed and up to date otherwise. It then rebuilds only the stale steps and those downstream of them. If the raw data change, all four downstream nodes are stale and all four rebuild. If only the plotting code changes, the figures and the report are stale but the cleaned data and the model are not. The model, which may have taken an hour to fit, is not re-fitted. The single command that triggers this, make or tar_make(), replaces the remembered sequence with one reliable act. The end-to-end doubt of the orientation is thereby dissolved, because the one act, by construction, runs everything that is out of date and leaves nothing behind.
10.4.1 The graph of an actual analysis
Figure 10.2 draws the shape in the abstract. But what does the shape cost over an analysis that actually runs? There the same shape is less tidy than the diagram, and the argument below depends on that untidiness.
library(tibble)library(knitr)time_it<-function(expr){t<-system.time(force(expr))[['elapsed']]round(1000*t, 1)}d<-survival::diabetict_load<-time_it(d<-survival::diabetic)t_clean<-time_it({d$arm<-factor(d$trt, levels =c(0, 1), labels =c('Untreated', 'Laser'))d<-d[!is.na(d$time), ]})t_fit<-time_it(fit<-survival::coxph(survival::Surv(time, status)~arm+age, data =d))t_boot<-time_it({set.seed(1)replicate(200, {i<-sample(nrow(d), replace =TRUE)unname(coef(survival::coxph(survival::Surv(time, status)~arm+age, data =d[i, ]))[1])})})steps<-tibble( Step =c('read raw data', 'derive arm labels','fit proportional-hazards model','bootstrap the treatment effect'), `Consumes` =c('--', 'raw data', 'cleaned data','cleaned data'), `Elapsed (ms)` =c(t_load, t_clean, t_fit, t_boot))kable(steps, align ='llr')
Table 10.1: The retinopathy analysis expressed as a dependency graph, with the cost of each step measured rather than asserted. The timings are from one run on one machine and will differ on another, and repeated runs on the same machine have varied by several-fold; even the ratios between steps should be read as illustrative, not as a stable property of the analysis. Note that the expensive step sits at the end, so an edit to the plotting code that forced a full rebuild would waste almost all of the total.
Step
Consumes
Elapsed (ms)
read raw data
–
0
derive arm labels
raw data
1
fit proportional-hazards model
cleaned data
5
bootstrap the treatment effect
cleaned data
277
On this build the bootstrap took 277 milliseconds, at least 97 percent of the four steps’ total, and none of the other three took more than 5 milliseconds. An analyst who re-runs everything after changing a label pays for the bootstrap to learn nothing. Every figure in these two paragraphs is an inline expression, for the reason Chapter 9 gives: had they been typed, the next machine to build the book would have made them false.
The table also carries a caveat about itself. These timings are computed when the book is built, so they describe the build machine and not the reader’s. A slower machine would show different absolute values, and so can a second run on the same machine. Even the ratio of the bootstrap to the model fit is unstable. The fit took 5 milliseconds on this build, a quantity so small that a millisecond or two of timer noise in that denominator moves the ratio several-fold from one run to the next. What held in every repeated run is the ordering: the bootstrap dominates the total, and the steps before it are negligible. That ordering, not any single number, is what the table supports. This is the same distinction the verification chapter draws between a result worth recording and a measurement worth repeating.
NoteCheck your understanding: reading the measured costs
Table 10.1 shows the bootstrap taking almost all of the total time. An analyst who changes only the color of a figure, then reruns the whole four-step chain by hand, without a pipeline, pays for which step unnecessarily? And which feature of the table should be expected to survive a change of machine?
NoteAnswer
The analyst pays for the bootstrap, the most expensive step, even though a color change touches nothing the bootstrap consumes; a selective rebuild would skip it entirely. The absolute timings are properties of the one machine that happened to build this chapter. They will differ, often by a large factor, on another machine or even on a repeated run of the same one. The ratio of the bootstrap to the fit is not stable either, because the fit’s few milliseconds sit near the timer’s resolution. What survives is the ordering: the bootstrap is by far the largest step, and it takes nearly all of the total. The table is read for which step dominates, not for any one number.
10.5 GNU Make: targets, prerequisites, and rules
We turn now from the idea to the tools. The oldest and most widely used pipeline tool is GNU Make, a reimplementation of the make utility first written in 1976 to compile programs. It has been pressed into service for data analysis ever since. Make is worth learning first, before any R-specific tool, for two reasons. First, its model is the simplest possible expression of the pipeline idea, so that understanding it is understanding pipelines in general. Second, its reach is language-agnostic. A single Makefile can orchestrate an analysis whose steps are written in R, Python, the shell, and a typesetting engine, without knowing or caring what language each step uses.
A Makefile is a list of rules, and a rule has three parts. The first is a target, the file the rule produces. The second is its prerequisites, the files the target depends on, written after a colon. The third is a recipe, the shell command that builds the target from its prerequisites. The recipe is written on the following line and, by an unforgiving convention, indented with a literal tab.
WarningPitfall
A text editor set to insert spaces for indentation will silently turn that leading tab into spaces, and what Make says then depends on the line. To see it, take the four-rule Makefile below and replace the tab before Rscript make_figures.R with eight spaces. GNU Make stops with Makefile:5: *** missing separator (did you mean TAB instead of 8 spaces?). Stop. With four spaces the hint disappears, and the bare ‘missing separator’ names a line but not the cause. A spaced recipe that contains a colon, such as the rmarkdown::render() line of the first rule, raises no error at all. Make reads it as one more rule, and report.html is left with no recipe. For a permanent fix, configure the editor to preserve a literal tab inside files named Makefile.
If we read the rules from the bottom up, the dependency graph is plain. cleaned.rds depends on the cleaning script and the raw data; model.rds depends on the fitting script and the cleaned data; and so on up to the report. Make never has to be told the order, because the order is implied by the prerequisites. It reads the whole Makefile, builds the graph, sorts it, and knows that cleaned.rds must be built before model.rds because the latter names the former as a prerequisite. To rebuild the analysis the analyst types a single command:
make report.html
or, since the first target in the file is the default, simply make. Make walks the graph and rebuilds what is needed, in order, and reports each recipe as it runs.
But how does Make decide what is needed? The mechanism is the one subtlety worth dwelling on, because it is both the source of Make’s power and the source of its most common surprise. Make is timestamp-based. It compares the modification time of each target against the modification times of its prerequisites. It considers a target out of date if any prerequisite is newer than the target. Suppose we edit fit_model.R; its modification time advances past that of model.rds. Make sees that model.rds is now older than a file it depends on and rebuilds it. That rebuild advances the timestamp of model.rds past that of figures.rds, and so the rebuild propagates downstream exactly as far as the change reaches and no further. A target all of whose prerequisites are older than it is already up to date. Make skips it, printing a line to the effect that there is nothing to be done. This is the selective rebuild of the previous section, implemented with nothing more than the file system’s clock.
The timestamp rule is also Make’s principal limitation. Make knows only whether a file is newer, not whether its contents have changed. Touching a file without editing it will trigger a needless rebuild. More subtly, a change that does not alter a file’s modification time will be missed. Make also tracks only what the analyst declares. It has no way to know that fit_model.R reads a configuration file unless that file is listed as a prerequisite. An undeclared input is invisible, and its change will not trigger the rebuild it should. Finally, Make tracks files and only files. It cannot cache an in-memory R object, so every step must serialize its result to disk, and the graph is a graph of files. These limitations are the opening that the R-native tools were built to close.
NoteCheck your understanding: what Make rebuilds
A project uses the four-rule Makefile above. The analyst edits make_figures.R to change a color palette and runs make. Which of the four targets does Make rebuild, and which does it skip? Explain your answer in terms of the timestamp rule.
NoteAnswer
Editing make_figures.R advances its modification time past that of figures.rds, so figures.rds is now older than one of its prerequisites and Make rebuilds it. Rebuilding figures.rds advances its timestamp past that of report.html, so report.html is rebuilt too. Make skips cleaned.rds and model.rds. Neither the raw data, the cleaning script, the fitting script, nor the cleaned data changed. Each of those targets therefore remains newer than all of its prerequisites and is up to date. The expensive model fit is not repeated.
10.6 targets: a function-oriented pipeline for R
Make treats an analysis as a graph of files built by shell commands. For an R analysis this is a slightly awkward fit. Every step must be a script that reads files and writes files, and the intermediate objects must all be serialized to disk by hand. Moreover, Make’s timestamp check is blind to the thing an R analyst most wants tracked, the R functions that do the work. The targets package, written by William Landau as the successor to his earlier drake(Landau, 2018, 2021), reworks the pipeline idea natively for R. It closes exactly these gaps.
The reframing is captured in the phrase ‘function-oriented’. In a targets pipeline the analyst writes the analysis as a set of R functions, one for each meaningful step. The analyst then declares a list of targets that connect those functions into a graph, in a special script named _targets.R at the project root. Each target is created by tar_target(), which names the target and gives the R expression that produces it. The package reads those expressions and notices that one target’s expression mentions another target’s name. From this it infers the dependency graph automatically, with no colons and no prerequisites to maintain by hand. A _targets.R for our running analysis reads:
library(targets)library(tarchetypes)tar_option_set(packages =c('dplyr', 'ggplot2'))# Analysis functions live in R/ and are sourced here.tar_source('R')list(tar_target(raw_file,'data/raw_data.csv', format ='file'),tar_target(raw_data, read_raw(raw_file)),tar_target(cleaned, clean_data(raw_data)),tar_target(model, fit_model(cleaned)),tar_target(figures, make_figures(model, cleaned)),tar_render(report, 'report.Rmd'))
The last line needs a word, because it is where a hand-written pipeline most often goes wrong. A report is a file produced from another file, the report.Rmd source. The target that renders it must therefore track that source as well as the results it displays. tar_render(), from the companion package tarchetypes, does both. It tracks report.Rmd as a file, and it reads the document for calls such as tar_read(model) and tar_load(figures), making each target so named a dependency of the report. Inside report.Rmd, results are therefore fetched with targets::tar_read() rather than recomputed. For a Quarto document, tar_quarto() plays the same role. The tempting alternative is a plain tar_target(report, render_report(model, figures), format = 'file'). It tracks the model, the figures, and the rendered HTML, but not the source. In a scratch run with targets 1.12.0 and tarchetypes 0.14.0, editing the report’s prose left tar_outdated() empty under that pattern, while under tar_render() it listed report. A report that does not rebuild when its own text changes is a stale report that the pipeline calls current.
Several features distinguish this from the Makefile. The intermediate results, raw_data, cleaned, model, figures, are R objects, not files. targets stores each in a hidden _targets/ store, keyed and versioned, and hands it to the next target as a plain R value. The analyst never writes a saveRDS or a readRDS, because the storage is the tool’s job. Where a real file must be tracked, such as the raw CSV at the top, the target is declared with format = 'file'. targets then watches the file’s contents, by hashing them, rather than the R object. tar_render() does the same for the report’s source and its rendered output.
That hashing is the second and deeper difference. Where Make compares timestamps, targets compares content hashes, so that a file touched but not changed does not trigger a rebuild. The hashing is not unconditional, however. When the trust_timestamps option is left unset, targets chooses by file system. On a file system with precise time stamps it trusts them: it compares a tracked file’s modification time with the one it recorded and recomputes the hash only if the two differ. A file whose content changed while its time stamp did not is therefore not caught. Such changes are rare in ordinary editing, but copying tools that preserve time stamps, and file systems with coarse time stamps, can produce them. In a scratch run with targets 1.12.0, a one-digit edit to the raw CSV with its time stamp restored left tar_outdated() empty under the default. Under tar_option_set(trust_timestamps = FALSE), by contrast, it listed every target downstream of the file, at the cost of hashing every tracked file on every check.
The hashing also extends past the data to the code. targets records a hash of the body of every function a target calls, and of the R expression in the target itself. Editing fit_model() therefore invalidates the model target, and everything downstream of it, even though no file has changed at all. Make, seeing only files, cannot detect such a change. A changed function invalidates exactly the targets that use it, directly or transitively, and no others. A change to make_figures() invalidates figures and report but leaves model untouched, and the expensive fit is preserved. Sensitivity to the versions of the packages a target loads is a separate matter, and one that targets does not provide. tar_option_set(packages = ...) merely attaches those packages to each target’s evaluation environment, as a call to library() would. By default targets does not track a package’s version or invalidate a target when that version changes. Version-sensitivity comes from the lockfile of Chapter 6, which is why Landau recommends using renv alongside targets.
Two commands drive the pipeline. To see the graph, tar_visnetwork() draws it as an interactive network, coloring each target by whether it is up to date or out of date. This is Figure 10.2 made live and queryable:
tar_visnetwork()
To run the pipeline, tar_make() walks the graph, in a fresh R session, and builds every target that is out of date while skipping every target that is up to date:
tar_make()
On the first run every target builds and targets reports each in turn. If we edit make_figures() and run tar_make() again, the output is eloquent. targets names figures and report as built, and reports raw_data, cleaned, and model as already current. In targets 1.12 and later the up-to-date targets are summarized as a count in the progress display rather than listed by name. The distinction between what rebuilt and what did not is unchanged. The analyst did not have to remember which steps the edit affected; the tool derived it from the graph and the hashes. A companion command, tar_outdated(), answers the end-to-end doubt directly. It lists the targets that a tar_make() would rebuild, without running anything. One can thus ask, at any moment, ‘what is stale?’ and get an exact answer.
TipVerification
To see this hold: in a project with _targets.R, run tar_make() once, then edit the body of any function a target calls, change nothing else, and run tar_outdated() before rebuilding. It should name that target and every target downstream of it, and no others. To make it fail on purpose, add a line to a function that instead reads a file directly with read.csv() rather than through a declared format = 'file' target. Change that file’s contents, and run tar_outdated() again. The target that silently reads the file will not appear, because targets cannot hash a dependency it was never told about. This is the same discipline failure Make suffers from an undeclared prerequisite.
NoteCheck your understanding: what targets tracks that Make does not
In the Makefile, editing the body of a function used by fit_model.R without changing any file’s dependency declaration might not trigger a rebuild of the downstream targets. Explain why targets does trigger it, and name the two things targets hashes that Make does not.
NoteAnswer
Make decides staleness by comparing file modification times against declared prerequisites, so a change that is not reflected in a listed prerequisite’s timestamp is invisible to it. targets instead hashes the contents of its inputs and also the bodies of the functions each target calls and the R expression in the target itself. Editing the function body changes its hash, which invalidates every target that calls it and everything downstream, so the rebuild propagates correctly. The two things targets hashes that Make does not are the R function definitions and the in-memory R objects (rather than only on-disk files). Together these let it track code changes and object changes that a timestamp comparison cannot see.
10.7 What a pipeline does, and does not, add
With both tools in hand, we may now ask what they have bought us. What a pipeline contributes to reproducibility is easily overstated in one direction and undersold in the other. The book’s capture-versus-validation framework allows a precise statement.
Recall the framework. A computational result depends on a stack of determinants: the operating system, the system libraries, the R version, the package versions, the session configuration, the data, the source. Reproducibility is secured by capturing each determinant, which is what a lockfile and a container do. It is secured also by validating that the capture suffices, which is what continuous integration and verification do. The ladder, L0 locatable, L1 pinned packages, L2 pinned environment, L3 verified, measures how far down the stack an effort has reached.
Against this framework the pipeline occupies a precise and initially surprising position: a pipeline captures no new determinant and adds no rung to the ladder. It does not pin a package version; that is the lockfile’s work, unchanged by whether a pipeline exists. It does not fix an environment; that is the container’s. It does not verify that an output is correct; that is verification’s. An analysis run through targets and an identical analysis run by hand, on the same machine, with the same packages, produce the same numbers and sit at the same level of the ladder.
Yet it would be wrong to conclude that the pipeline is reproducibility-neutral. The reason returns us to the distinction that organizes the book. What a pipeline does is mechanize the re-execution that validation depends on. Verification, in Chapter 12, checks that rebuilding the analysis from its captured inputs reproduces the recorded outputs; continuous integration runs that rebuild on every change, in a clean machine. Both presuppose that ‘rebuild the analysis’ is a single, reliable, complete act. A manually run analysis cannot guarantee precisely that act, because the human running it may re-run some steps and forget others. The pipeline turns ‘rebuild the analysis’ from a remembered sequence into one command whose completeness is structural. In doing so it removes the ‘did I re-run everything?’ doubt that undermines every validation step. Like continuous integration, a pipeline captures no determinant and adds no rung; it makes the re-execution that verification (Chapter 12) confirms reliable and repeatable.
The relation to continuous integration is especially close, and worth making explicit, because the two are sometimes confused. Continuous integration is the machine that is not ours, running the rebuild in a clean environment on every change. The pipeline is the definition of what ‘the rebuild’ means. They compose naturally. For a pipelined project, a CI workflow’s core step is to restore the environment and then run tar_make() or make. The pipeline supplies the re-execution, and CI supplies the clean, automatic, external trigger for it. Neither replaces the other. The pipeline without CI still requires a human to remember to run it; CI without a pipeline must hard-code the sequence of steps that the pipeline would have derived from the graph. Together they close the loop. A change is pushed, a clean machine rebuilds the analysis, and the result is checked, with no act of memory anywhere in the chain. On a clean runner the _targets/ store is absent, because it is not in the checkout, so the rebuild runs the whole graph, which is itself the clean-rebuild test. A runner rebuilds only what a change made stale when the store is restored between runs, from a cache or a cloud store.
NoteCheck your understanding: the composed claim
A team reports that ‘every push rebuilds and tests the analysis, so it is reproducible.’ Using this section’s account of what CI and the pipeline each contribute, what exactly has been shown, and what rung, if any, has been demonstrated?
NoteAnswer
What has been shown is that the pipeline’s definition of ‘rebuild’ runs to completion on an external, clean machine on every change, which is strong evidence of re-execution. It is not, by itself, evidence of any rung. CI supplies the clean trigger and the pipeline supplies the complete recipe, but neither pins a package, fixes an environment, or compares an output with a recorded baseline. The rung actually reached depends entirely on whether a lockfile, a container, and a baseline comparison also exist. ‘It runs on every push’ answers a question about re-execution, not about level.
ImportantThe honest level
This chapter’s own practice runs tar_make() and make to completion on demand. That demonstrates re-execution and nothing about the level actually reached. The level is settled only by the lockfile, the container, and the baseline comparison of the chapters this one does not replace.
10.8 Pipelines across the archetypes
We turn next to how much of this machinery each kind of project needs. The weight a pipeline tool carries varies sharply across the research archetypes; Table 5.2 in Chapter 5 is the reference. It is most useful for the data-analysis archetype’s chain of transforms, run and re-run as the cleaning and the model are adjusted. It is stronger still for a simulation study. There targets’ branching, creating one target per parameter setting from a single declaration, maps a whole parameter grid onto the dependency graph, so adding a setting rebuilds only the new cell. A manuscript’s pipeline is present but modest and often implicit, since the sealed report.Rmd of Chapter 9 is itself a small, one-target build. The sharpest contrast is the R-package archetype, which has no analysis pipeline at all. A package is a library of functions, not a chain of data transforms producing a report, and its ‘re-execution’ is R CMD check (Chapter 11), not tar_make(). The blog archetype returns to a pipeline, but over documents rather than an analysis. Its natural rebuild touches only the posts whose sources changed, the role workflowr fills in the next section. Reach for the tool where re-execution is frequent or costly, and do not impose its overhead where a single render suffices.
NoteCheck your understanding: an archetype with no pipeline
A reader building an R package asks why this chapter never shows a _targets.R for it. What is the answer, and what plays the corresponding role?
NoteAnswer
A package has no chain of data transforms producing a report, so there is no dependency graph of the kind a pipeline tool rebuilds selectively. Its deliverable is a library of functions, not a sequence of derived outputs. R CMD check, together with the test suite, plays the corresponding role. It determines what must be re-verified given what changed and refuses to accept a stale result. This is the same job a pipeline does for a data analysis, performed by the package toolchain instead.
10.9 Beyond R: Snakemake, Nextflow, and workflowr
Make and targets are the right tools for an R-centric analysis. However, a reader whose work reaches beyond R, or beyond a single machine, should know the tools that dominate computational science more widely. In pipelines, the R ecosystem is a small part of a much larger field.
The two dominant language-agnostic pipeline managers come from bioinformatics. There, analyses routinely chain dozens of command-line tools across terabytes of sequencing data and must run at the scale of a computing cluster or a cloud. Snakemake, by Köster and Rahmann, extends the Make model, rules with inputs and outputs, into a Python-based language. That language has pattern rules, wildcards, and native awareness of cluster schedulers, so that a single workflow definition can fan a computation out across thousands of jobs (Köster & Rahmann, 2012). Nextflow, by Di Tommaso and colleagues, takes a different, dataflow approach, connecting processes through channels. It is built from the ground up for portability across high-performance-computing clusters and cloud platforms, with containerization of each step as a first-class feature (Di Tommaso et al., 2017). Both far exceed Make and targets in their handling of scale and heterogeneity. Both are the correct choice when an analysis spans many languages and many machines. For a first-year health-sciences analysis run on a laptop or a single server in R, they are heavier than the problem requires. A reader moving into genomics or large-scale imaging, however, will meet them quickly and should recognize them as the same pipeline idea scaled up.
Closer to home, workflowr, by Blischak and colleagues, serves the specific case of a reproducible research website (Blischak et al., 2019). This covers the blog archetype above and the versioned analysis site more generally. Its contribution is less the pipeline than the binding of each rendered result to version control. workflowr rebuilds the documents that have changed and stamps each rendered page with the git commit of the source that produced it. Every published figure thus carries, visibly, the version of the code behind it. It is the natural tool where the deliverable is a website of analyses that must each be traceable to a commit. It also composes with the version-control discipline that runs through this book.
The pipeline idea, express the analysis as a dependency graph and rebuild only what is stale, is common to all five tools. The choice among them is a choice of scale and setting. Make is the language-agnostic minimum, and targets is the R-native tool that tracks objects and functions. Snakemake and Nextflow are the same idea at cluster and cloud scale, and workflowr is the idea applied to a versioned website. We now put the R-native tool to work on a concrete case.
NoteCheck your understanding: choosing among the five tools
A genomics collaborator’s analysis chains forty command-line tools across a cluster, written in a mix of Python and shell. Which of this section’s tools fits, and why would targets be the wrong reach here?
NoteAnswer
Snakemake or Nextflow fits. Both are built for exactly this setting, many languages, many steps, and execution spread across a cluster or the cloud, with native support for job schedulers. Make has none, and targets reaches a scheduler only through backends such as clustermq. targets would be the wrong reach because it is R-native. Its dependency inference works by hashing R function bodies and R objects. That has nothing to track in a pipeline whose steps are Python scripts and shell commands calling external tools. The pipeline idea is the same; the tool must match the language and the scale.
10.10 Worked example
To illustrate, we convert the running analysis from a set of hand-run scripts into a targets pipeline, as a health scientist tidying a working project would. The analysis begins as four scripts in analysis/scripts/, run in order at the console. One cleans data/raw_data.csv and saves cleaned.rds, one fits a model and saves model.rds, one draws figures, and one renders the report. The project works, but every correction to the raw data sets off the manual re-running the orientation warned against.
The first step is to refactor the scripts into functions, before any _targets.R is written, because a function-oriented pipeline needs functions. Each script’s body becomes a function in R/: read_raw(), clean_data(), fit_model(), and make_figures(). Each takes its inputs as arguments and returns its result rather than reading and writing files by side effect. The fourth script, the report, becomes report.Rmd. It fetches the model and the figures with targets::tar_read() instead of recomputing them, so that tar_render() can see what it depends on. This refactoring is worthwhile on its own. Functions with explicit inputs and outputs are testable in the sense of Chapter 11, where a script that reads and writes global files is not.
The second step is the _targets.R shown earlier in the chapter. It declares the six targets: the raw file, the read data, the cleaned data, the model, the figures, and the report. It then lets targets infer the graph from the way each target’s expression names the targets before it. With the file in place, tar_visnetwork() draws the graph, and the analyst confirms it carries the intended structure of Figure 10.2. Every node is initially colored ‘outdated’ because nothing has been built yet. Figure 10.2 is a simplified linear schematic of the chain from raw data to report. The actual dependency graph is more connected. The _targets.R declares that figures depends on both model and cleaned and that report depends on both model and figures. Hence tar_visnetwork() draws those extra cross-edges that the schematic omits.
The third step is to build the pipeline once, with tar_make(). This runs all six targets in dependency order in a fresh session and populates the _targets/ store. A correction to the raw data, followed by tar_make(), rebuilds all five downstream targets and skips nothing, because everything depends on the data. A refinement to make_figures(), followed by tar_make(), rebuilds only figures and report. raw_data, cleaned, and model are left untouched, the model fit, the expensive step, among them. In current versions of targets the console reports the untouched targets only as a skip count. A change to the wording of the discussion in report.Rmd rebuilds report alone. At any moment tar_outdated() answers the question the manual workflow could never answer with confidence. It lists precisely the targets a rebuild would touch, so that the analyst always knows whether the project is current.
The final step ties the pipeline to the validation machinery of the surrounding chapters. The pipeline runs inside the pinned environment of Chapter 7, restored from the lockfile of Chapter 6. Thus tar_make() re-executes against fixed packages and a fixed R. The continuous-integration workflow of Chapter 12 is given one core instruction, to restore the environment and run tar_make(). Every push then rebuilds the whole pipeline on a clean machine, since the runner starts without a _targets/ store. The ‘did I re-run everything?’ doubt is answered, permanently, by a machine that is not the author’s.
NoteCheck your understanding: the two-target split
The worked example’s _targets.R declares raw_file with format = 'file' and a separate target raw_data that reads it, rather than one target that both names the path and reads it. Why does the split matter, and what would go wrong without it?
NoteAnswer
format = 'file' tells targets to hash whatever the target’s own return value points to. Only a target that returns a path, such as the string 'data/raw_data.csv', can carry that option. read_raw(raw_file) returns a data frame, not a path. Declaring it format = 'file' would make targets try to hash a data frame as though it were a file path and fail. Splitting the tracked file from the object read from it is what lets targets watch the raw file’s contents while still storing the loaded data frame as an ordinary R object.
NoteCheck your understanding: complete the _targets.R
The worked example’s _targets.R, first shown in the section on targets, is reprinted here with four decisive lines replaced by numbered placeholders. Write each missing line, using only the functions and target names the worked example defines.
library(targets)library(tarchetypes)tar_option_set(packages =c('dplyr', 'ggplot2'))# Analysis functions live in R/ and are sourced here.tar_source('R')list(tar_target(raw_file,'data/raw_data.csv',# (1) ____: hash the file's contents, not an R object),# (2) ____: read the raw file through its target nametar_target(cleaned, clean_data(raw_data)),tar_target(model, fit_model(cleaned)),# (3) ____: draw the figures from the model and the data# (4) ____: render report.Rmd, tracking its source)
NoteAnswer
The four missing lines of the worked example’s _targets.R are these.
format = 'file'. It belongs on raw_file because that target returns a path; on a target that returns a data frame, targets would try to hash the data frame as a file path and fail.
tar_target(raw_data, read_raw(raw_file)),. Naming raw_file in the expression is what declares the dependency. A plausible read_raw('data/raw_data.csv') reads the same file, but targets was never told about it and cannot see a change to it.
tar_target(figures, make_figures(model, cleaned)),. Naming both targets draws the edges from model and from cleaned; a figure function that fetched the data some other way would hide the second edge from the graph.
tar_render(report, 'report.Rmd'). The tempting tar_target(report, render_report(model, figures), format = 'file') tracks the model, the figures, and the rendered HTML but not the source, so editing the report’s prose leaves tar_outdated() empty.
10.11 The cohort, continued
This chapter has so far reasoned about pipelines through a composite analysis. We now apply the same idea to this book’s own compendium. Here is a two-node graph, raw extract to cleaned cohort, with the cost of each step measured, as Table 10.1 did for the retinopathy example.
cohort_path<-'../data/raw_data/cohort_raw.csv't_load_cohort<-time_it(raw<-load_cohort(cohort_path))t_clean_cohort<-time_it(cohort<-clean_cohort(raw))cohort_steps<-tibble( Step =c('load_cohort()', 'clean_cohort()'), Consumes =c('cohort_raw.csv', 'the raw data frame'), `Elapsed (ms)` =c(t_load_cohort, t_clean_cohort), `Rows out` =c(nrow(raw), nrow(cohort)))kable(cohort_steps, align ='llrr')
Table 10.2: The two steps load_cohort() and clean_cohort() perform on the running cohort compendium, with elapsed time measured on one run on the machine that built this chapter; repeated runs vary and should not be read as a stable property of either function.
Step
Consumes
Elapsed (ms)
Rows out
load_cohort()
cohort_raw.csv
2
338
clean_cohort()
the raw data frame
2
337
The two functions are already, in effect, a two-rule pipeline. clean_cohort() consumes what load_cohort() produces, and nothing downstream exists yet. No later chapter’s model or report has been wired to this extract through targets or a Makefile. Suppose a correction were made to cohort_raw.csv today, by hand. The only way to know that clean_cohort()’s output had gone stale would be to remember to re-run this cell. That is exactly the end-to-end doubt the orientation opened with, now visited on the book’s own running example. Expressing this pair as three targets would make that staleness mechanical rather than remembered:
list(tar_target(raw_file, cohort_path, format ='file'),tar_target(raw, load_cohort(raw_file)),tar_target(cleaned, clean_cohort(raw)))
The raw_file target is what makes targets watch the CSV’s contents. Without it, a lone tar_target(raw, load_cohort(cohort_path)) would track only the value of the string cohort_path, and a corrected CSV at the same path would leave raw current. The cost is a three-target scaffold in the pattern of the five-target one shown in Exercise 3’s solution below. The repository holds a lockfile but no Dockerfile, which places the compendium at L1. Adding the pipeline would not move it off that rung, since a pipeline pins no determinant. It would only make the one existing transform trustworthy to rebuild without having to recall that it exists.
NoteCheck your understanding: what the pipeline would, and would not, fix
Suppose the three-target pipeline above has been built once, and cohort_raw.csv is then corrected. What would tar_outdated() report, and would adding the pipeline change the compendium’s rung on the L0 to L3 ladder?
NoteAnswer
tar_outdated() would report all three targets, raw_file, raw, and cleaned, as out of date. The file target raw_file hashes the corrected CSV’s new contents, raw depends on raw_file, and cleaned depends on raw. No, the rung would not change. The pipeline would still pin no package version, no R runtime, and no operating system. The compendium would therefore remain at L1, the rung set by what the repository holds (a lockfile but no Dockerfile), whatever tar_outdated() reports. The pipeline only guarantees that a rebuild, once triggered, rebuilds the right things.
10.12 A language model inside the pipeline
The rest of this chapter treats every step as code the analyst controls. A step that sends text to a language model is different in kind. Examples include coding free-text clinical notes for smoking status and extracting a variable from a radiology report. In the terms of Chapter 3, the model is a dependency that no rung pins. It runs remotely, under an identifier the provider can update or retire, and it need not return the same output twice for the same input. A lockfile cannot record it, and a container cannot hold it.
The remedy is to treat the responses as data rather than as computation. Four practices follow.
Cache responses as versioned derived data. Store them in a committed file, one row per input, keyed by a hash of the input text, the prompt version, and the model identifier, and let the pipeline read that file. The _targets/ store is not enough on its own, because it is absent from a fresh clone, and a rebuild there would query the model again.
Record the model and its settings. Each row carries the model identifier the endpoint reported, the parameters sent, and the date of the query.
Version prompts as code. A prompt is a file in the compendium, changed only by commit, and its hash enters the key.
Treat a re-query as a new measurement. Responses obtained again, after a change of prompt or model or the loss of the originals, are a second rater’s codes, not a re-execution. Report their agreement with the first set rather than presenting them as the same result.
The inputs fall under the restricted-data rule of the next section before any query is made. Clinical notes are among the most identifying records a study holds. The responses derived from them inherit the notes’ restrictions, which decides where the cache may be deposited.
The fragment below is illustrative and abridged, and it is not run. The query itself lives in a separate script that the analyst runs by hand and whose new rows the analyst reviews before committing. tar_make() never contacts the endpoint: join_responses() matches each note to its row and stops with a list of the missing keys rather than filling them.
# _targets.R (illustrative and abridged; not run)library(targets)tar_source('R')list(tar_target(notes_file, 'analysis/data/raw_data/notes.csv', format ='file'),tar_target(prompt_file, 'analysis/prompts/smoking-v2.txt', format ='file'),tar_target(responses_file,'analysis/data/derived_data/smoking-responses.csv', format ='file'),tar_target(notes, read_notes(notes_file)),tar_target(smoking,join_responses(notes, responses_file, prompt_file, model_id ='<model identifier>')))
A clean rebuild then reproduces the coded data exactly. The claim it supports is correspondingly narrow: the analysis is reproducible given the committed responses, not the model’s coding of the notes.
10.13 Collaborating with an LLM
A language model is a fluent author of Makefiles and targets pipelines. Its characteristic failures are worth anticipating, because they bear directly on the one discipline this chapter rests on, the honesty of the dependency declarations.
ImportantRestricted data
One rule comes first (habit 3). Never paste or upload protected health information, identifiable records, or data held under a data use agreement, nor outputs derived from them, into a model or a coding agent unless three conditions all hold. The institution has approved that endpoint for that class of data. The IRB protocol and the consent permit the processing. The data use agreement, or the provider’s terms, permits it. If any of the three is unclear, the answer is no.
The third condition is the one most often missed. Institutional approval of a tool does not override the terms under which a data provider released the data. NIH, for example, treats sharing controlled-access data through prompts with public generative AI tools, which it glosses as third-party tools, as a breach of the data use certification. It treats a model trained on such data as a data derivative, to be shared only with other approved users and not kept after the project closes (National Institutes of Health, 2025).
Describe the structure instead: the column names and types, or a small synthetic example generated from the data dictionary, never edited from real rows. A coding agent sees whatever files are in its working tree, so run it in a checkout or container where the real data is not mounted.
An agent also acts, so confine it to a branch and keep merges, pushes, and deposits for yourself (Section 2.10.1).
For a pipeline, the structure to describe is the scripts, the files each reads and writes, and the column names and types of the data. A printed data frame or a log of row-level output is derived output under the rule. A coding agent asked to convert or run a pipeline will execute it and so read every input it touches.
Prompt. ‘Write a Makefile for my analysis: I have a cleaning script, a modeling script, and a report.’
Watch for. The model cannot know the analyst’s true dependencies, so check every rule for a guessed one. Look for an omitted prerequisite, such as a configuration file the modeling script reads or a helper script the cleaning script sources. Such a Makefile looks complete but fails to rebuild when the undeclared input changes. Check also for spaces where Make demands a literal tab to indent recipes, a classic error that produces a ‘missing separator’ message or, on a recipe line containing a colon, no error at all.
Verification. Check every rule against what each step actually reads and writes: list, for each script, its real inputs, and confirm each appears as a prerequisite. The decisive test is operational. Build once, then touch each declared input in turn and confirm the expected targets rebuild. Then touch an undeclared file the step secretly reads and confirm, as a negative check, that the Makefile wrongly fails to rebuild, which reveals the missing prerequisite.
Prompt. ‘Convert my scripts to a targets pipeline.’
Watch for. Check for format = 'file' used incorrectly, and for targets that read files directly inside the target expression without declaring them as file targets. targets then cannot see the dependency and will not rebuild when the file changes. Check also that the scripts were refactored into functions that return values, not left as scripts called for their side effects, which defeats the object-tracking that is the whole reason to prefer targets over Make. Finally, check for a report target that calls rmarkdown::render() inside a plain tar_target(), which never tracks the report’s source.
Verification. Confirm that every external file the pipeline depends on is a tar_target(..., format = 'file') and that intermediate results are returned R objects, not files written by side effect. Then run tar_make(), edit one function body, and confirm with tar_outdated() and a second tar_make() that exactly the dependent targets, and no others, rebuild. Edit one sentence of the report’s prose and confirm that tar_outdated() lists the report. If a change to a function fails to invalidate a downstream target, the dependency is not being tracked and the pipeline is lying about what is current.
A better prompt. ‘Convert the three attached scripts to a targets pipeline. Their inputs and outputs are listed below, with column names and types but no data. Refactor each step into a function in R/ that returns a value, declare every file the pipeline reads as a format = 'file' target, and render the report with tar_render(). Then list, for each function, the targets an edit to it should invalidate, so that I can check the list against tar_outdated().’
Prompt. ‘Add a step to my pipeline that sends each free-text note to <tool name> and codes it as current, former, or never smoker.’
Watch for. Check where the call sits. A call inside a target expression makes every rebuild of that target a fresh query, so a corrected upstream file or a tar_destroy() silently re-codes every note, unchanged ones included, as a new measurement. Check also that the model identifier, the parameters, and the prompt appear in committed files rather than in the code’s defaults.
Verification. Restructure the step as Section 10.12 describes: responses in a committed file, keyed by input hash, prompt, and model identifier, and a pipeline that reads that file and never calls the endpoint. Then run tar_make() from a fresh clone with the network disabled and confirm that it completes. Before any note is sent, apply the restricted-data rule above. If a coding agent builds the step, the analyst runs the query script, reviews the new responses, and commits them; an agent that runs tar_make() or tar_destroy() should do so only in a checkout where the real notes are not mounted (Section 2.10.1).
10.14 Exercises
Take a multi-step analysis of your own that you currently run by hand, and draw its dependency graph on paper: a node for each step, an arrow for each ‘consumes the output of’ relation. Confirm the graph is acyclic. Then identify, for a change to one upstream input of your choosing, exactly which nodes are downstream of it and would need to rebuild, and compare that set to the steps you would, in practice, remember to re-run by hand.
Write a Makefile of three or four rules for the analysis of the previous exercise. Run make, then edit one intermediate script and run make again, and record which targets rebuilt and which were skipped. Explain the result in terms of the timestamp rule. Then touch an input without changing its contents, run make once more, and explain why Make rebuilds a target whose contents did not change.
Convert the same analysis to a targets pipeline. Refactor each step into a function in R/, write _targets.R, and confirm with tar_visnetwork() that the graph matches the one you drew in exercise 1. Run tar_make(), then change the body of one function and, before rebuilding, predict with tar_outdated() which targets will rebuild. Run tar_make() and check your prediction.
Demonstrate the difference between Make’s and targets’ staleness checks. Choose a helper function that one of your scripts sources from a file the Makefile of exercise 2 does not list as a prerequisite. Edit its body in a way that changes the result, and confirm that targets invalidates the dependent targets. Explain, in one or two sentences, why the same edit could be missed by a Makefile that tracked only the script files’ timestamps.
State, in the book’s capture-versus-validation terms, what your pipeline has and has not added to the reproducibility of your project. Name the level on the ladder your project sits at, and identify what you would still need to do, a lockfile, a container, a verification against a baseline, to raise it, making explicit that none of those is supplied by the pipeline itself.
For each of the five archetypes, the data analysis, the simulation study, the manuscript, the R package, and the blog, write one or two sentences stating whether an analysis pipeline is central, modest, or absent, and why. For the archetype in which it is absent, name the mechanism that plays the corresponding role instead.
Run cohort <- clean_cohort(load_cohort('analysis/data/raw_data/cohort_raw.csv')) and report nrow(cohort). Then write the three-target _targets.R fragment that wraps load_cohort() and clean_cohort() on this path, following the raw_file and raw split of Exercise 3’s solution, and state what tar_outdated() would report immediately after the first tar_make() and after a second one with no file changed.
This exercise returns to the reproducibility ladder of Chapter 3 (Chapter 3). A project has a lockfile, a container, and a targets pipeline that runs green on every push, but no test compares a computed quantity with a value recorded earlier. State the single rung of the L0 to L3 ladder this project occupies, and name the one artifact, absent here, whose addition would be needed to reach the next rung.
Take the illustrative _targets.R fragment of the section on a language model inside the pipeline (Section 10.12). For each of four situations, state which targets tar_outdated() would list and what the next tar_make() would do: (a) a fresh clone, with the response file committed and no _targets/ store;
a corrected spelling in one note; (c) a new version of the prompt file; (d) a new model identifier in _targets.R. Then say which situations call for a new query, and why its result is a new measurement rather than a re-execution.
10.15 Solutions
Attempt an exercise before expanding its solution. Every exercise in this chapter is performed on an analysis of the reader’s own, so the outputs vary; the boxes record what should happen and the reasoning that makes it expected.
NoteExercise 1
No single correct answer. What a good answer establishes is the gap between the downstream set and the remembered set.
On acyclicity: the graph must be acyclic because a cycle would mean a step consumes, directly or indirectly, its own output. There would then be no order in which to run the steps. Readers occasionally draw what looks like a cycle and find on inspection that they have drawn two different versions of one file as a single node. Splitting the node resolves it, and the resolution is itself informative, since it names an artifact that is overwritten in place.
The instructive part is the comparison. The downstream set of a change to a raw input is, in most analyses, everything: cleaning, modeling, every figure, every table, the report. The set most analysts re-run by hand is smaller, and it is smaller in a characteristic way. People reliably re-run the step they just edited and the thing they are looking at. They reliably forget the intermediate results that nothing on screen depends on, along with any figure that is not in the document currently open.
The downstream set is a property of the graph, and a person holding the graph in their head computes it correctly only for small graphs and recent memory. A pipeline tool computes it from the graph every time.
NoteExercise 2
Editing an intermediate script rebuilds that script’s target and everything downstream of it, and skips everything upstream and everything on a parallel branch. The timestamp rule explains it directly. Make rebuilds a target whose modification time is older than any of its declared prerequisites. Rebuilding a target advances its own timestamp, so staleness propagates forward one link at a time.
Why touch triggers a rebuild. Because Make does not compare contents at all. It compares modification times, and touch advances the modification time of the input without changing a byte of it. Every target depending on that input is now older than one of its prerequisites, so Make rebuilds it, and the rebuild propagates downstream exactly as a real edit would.
Make’s guarantee is therefore conservative in one direction and unreliable in the other. It will happily rebuild things that did not need rebuilding, which costs time and nothing else. It will also miss a change that leaves timestamps as it found them, which costs correctness. The first behavior is the one this exercise demonstrates; the second is the subject of exercise 4.
NoteExercise 3
The refactoring is the substance of the exercise. Each Make rule becomes a function in R/, and _targets.R declares the targets that call them:
list(tar_target(raw_file,'data/raw_data.csv', format ='file'),tar_target(raw, read_raw(raw_file)),tar_target(cleaned, clean_data(raw)),tar_target(model, fit_model(cleaned)),tar_target(figures, make_figures(model, cleaned)))
format = 'file' belongs on raw_file, not on raw: it tells targets to hash the file at the path a target returns, and only raw_file returns a path (the string literal above). raw returns the data frame that read_raw() builds from that path. Declaring it format = 'file' therefore makes targets try to hash a data frame as if it were a file path and error. The two-target split, one target for the tracked file and one for the object read from it, mirrors the pattern used earlier in this chapter for the same reason.
tar_visnetwork() should show the same nodes and arrows as the hand drawing. A mismatch is informative and usually means the hand drawing missed a dependency, since targets derives the graph from the code rather than from memory.
On the prediction: after editing a function body, tar_outdated() names that function’s target and everything downstream, and tar_make() rebuilds exactly that set. Readers who predicted correctly have understood the propagation rule; readers who predicted too small a set usually forgot that invalidation is transitive.
The prediction is easy here and was hard in exercise 1, on the same analysis, because targets made the graph visible: the reader now reads the dependency structure instead of recalling it.
NoteExercise 4
Editing a function body in R/ changes no file that a Makefile would ordinarily list as a prerequisite of the model target. The Makefile lists the script that fits the model, not the helper file the script sources. targets invalidates the dependent targets anyway, and tar_outdated() names them before the rebuild.
Why a Makefile could miss the equivalent edit. Because it tracks the timestamps of the files it was told to track, and nothing told it about the helper. If fit_model.R sources R/helpers.R and the rule declares only fit_model.R as a prerequisite, then editing helpers.R advances a timestamp Make never looks at. Every downstream target remains, in Make’s view, up to date. The analysis then reports results computed by the old function body, with no error and no indication that anything is stale.
targets avoids this because it hashes the bodies of the functions each target calls, and the R objects those targets produce, rather than the modification times of a declared file list. Because the dependency is discovered from the code, the analyst cannot declare it incompletely.
The fair statement of the comparison is that a correctly and completely written Makefile would catch this too. The difference is that targets makes completeness the default and Make makes it the analyst’s responsibility, and the failure mode of an incomplete Makefile is silence.
NoteExercise 5
What the pipeline added. In the book’s terms, almost nothing on the capture side and a good deal on the validation side. The pipeline pins no layer of the determinant stack: not the packages, not the environment, not the R version. What it adds is a guarantee that the outputs are current with respect to the inputs, which is a form of internal consistency the analysis did not previously have. It also adds an explicit, machine-readable statement of the analysis structure, which is documentation of a kind that cannot drift.
The level. The pipeline alone leaves the project where it was, which for most readers is L0. This is the part of the exercise most likely to be answered wrong, because a targets pipeline feels like a large step forward and is, on an axis the ladder does not grade.
What would still be needed. A lockfile to reach L1, a container to reach L2, and verification against a recorded baseline to reach L3. None of the three is supplied by the pipeline, and the pipeline does not make any of them easier or harder to add; they are orthogonal.
There is one honest qualification in the pipeline’s favor. Because it computes rather than remembers the downstream set, it removes a class of error, stale outputs, that would otherwise defeat an L3 verification. Such a failure would arise for reasons having nothing to do with the environment. It does not raise the level, and it makes the level easier to keep.
NoteExercise 6
Data analysis: central. The archetype is a chain of steps producing derived data and results, which is exactly what a dependency graph describes.
Simulation study: central. Replicates are expensive and independent, so recomputing only what is stale matters more here than anywhere, and targets branching maps onto the replicate structure directly.
Manuscript: modest. There is usually a pipeline behind the manuscript, but the render itself is a single terminal step and the literate document does much of the orchestration. The pipeline earns its place when the analysis feeding the document is expensive enough that re-running it on every render is intolerable. That is the same judgment the previous chapter framed as deciding what the document computes at build time.
Blog: modest to absent. Each post is typically small and self-contained, and the site generator already rebuilds changed posts. A pipeline adds machinery for little gain.
R package: absent. There is no chain of data transformations to schedule; the deliverable is a set of functions. The mechanism that plays the corresponding role is R CMD check together with the test suite, which performs the analogous job of determining what must be re-verified and doing it. The analogy is closer than it looks: both answer ‘given what changed, what must be recomputed’, and both refuse to accept a stale result.
NoteExercise 7
The solution for this exercise is in the instructor guide, which is distributed separately to course instructors. Self-study readers who want to check their answer can compare the autogradable value and the _targets.R fragment against those reported in the chapter’s own ‘The cohort, continued’ section.
NoteExercise 8
The project is at L2, pinned environment, and no further. The lockfile and the container pin the packages and the environment, and a targets pipeline that runs green on every push demonstrates that the analysis re-executes completely and reliably in that pinned environment. None of this is a baseline comparison. A green pipeline run shows that the code ran without error, not that any reported quantity still matches a value recorded earlier. This is exactly the L2-versus-L3 distinction Chapter 3 draws for a test suite with no baseline test.
The missing artifact for L3 is a baseline test, a test that recomputes a reported quantity and compares it with a value committed to the repository within a stated tolerance. Making the pipeline run the step that triggers that test inside continuous integration, as Chapter 12 describes, is what turns the green run from a statement about re-execution into evidence for L3. This chapter’s worked example stops short of that step: it has no baseline test.
NoteExercise 9
In (a) there is no store, so every target is outdated. tar_make() rebuilds them all from the committed files, and smoking is reproduced exactly, because join_responses() reads the committed responses and the endpoint is never contacted. This is the case the design exists for.
In (b) the hash of notes_file changes, so notes and smoking are outdated. The corrected note has new text, and therefore a new key with no row in the response file, so join_responses() stops and names that one note. In (c) the hash of prompt_file changes, so smoking is outdated; because the prompt’s hash enters every key, every note is now missing and the stop names them all. In (d) the command of smoking changes, which outdates it, and again every key is missing.
Situation (a) needs no query. Situation (b) needs one query, for the corrected note, and (c) and (d) need a query for every note. You run those queries with the separate script, review the new rows, and commit them beside the old ones. Their result is a new measurement because the model, as reached on a later date, need not return what it returned before, even under an unchanged identifier, and in (c) and (d) the instrument itself has changed. Where old and new codes exist for the same note, report their agreement, as you would for a second rater.
10.16 Cheat sheet
Command or rule
What it means or checks
Rule: target: prerequisites
Declares a Make target and the files it depends on
Make recipe line
Indented with a literal tab, never spaces (Pitfall above)
make
Rebuilds every target older than one of its prerequisites
touch file
Advances a file’s timestamp without changing its contents; triggers Make, not targets
tar_target(x, expr)
Declares a targets target; the dependency graph is inferred from expr
tar_target(x, path, format = 'file')
Tracks x as a file, by content hash, not by R object
tar_make()
Builds every out-of-date target, in order, and skips the rest
tar_outdated()
Lists what a tar_make() would rebuild, without running anything
tar_visnetwork()
Draws the dependency graph, colored by up to date or out of date
tar_render() / tar_quarto()
Tracks a report’s own source as well as the targets it reads
Capture vs. validation
A pipeline captures no determinant; it validates that an output is current
Honest claim
‘The pipeline re-executes reliably’ is not ‘the analysis is reproducible’; name the rung separately
LLM response cache
A committed file of model responses keyed by input hash, prompt version, and model identifier; the pipeline reads it and never queries (Section 10.12)
10.17 Further reading
The definitive source on targets is its documentation and the short paper that introduces it, Landau (2021). That paper states the ‘function-oriented, Make-like’ design directly and is the natural starting point for an R analyst. Its predecessor Landau (2018) documents drake, which a reader will still meet in existing projects and which shares the same conceptual model. The manual-steps critique that motivates the whole chapter is put crisply by Sandve et al. (2013). Their rules on automating the path from raw data to result are the pipeline idea stated as a rule of conduct. For the language-agnostic and large-scale tools, Köster & Rahmann (2012) introduces Snakemake and Di Tommaso et al. (2017) introduces Nextflow. Both repay reading by anyone whose work will move into bioinformatics or onto a cluster. The workflowr approach to binding rendered results to version-control commits is described in Blischak et al. (2019). GNU Make itself is documented in its own extensive manual. A reader will consult it for the pattern rules and automatic variables that this chapter’s minimal treatment omitted. For data-analysis uses specifically, the broader software-carpentry literature on reproducible workflows, of a piece with Wilson et al. (2014) and Wilson et al. (2017), situates Make in the analyst’s toolkit rather than the programmer’s.
Blischak, J. D., Carbonetto, P., & Stephens, M. (2019). Creating and sharing reproducible research code the workflowr way. F1000Research, 8, 1749. https://doi.org/10.12688/f1000research.20843.1
Di Tommaso, P., Chatzou, M., Floden, E. W., Prieto Barja, P., Palumbo, E., & Notredame, C. (2017). Nextflow enables reproducible computational workflows. Nature Biotechnology, 35(4), 316–319. https://doi.org/10.1038/nbt.3820
Landau, W. M. (2018). The drake R package: A pipeline toolkit for reproducibility and high-performance computing. Journal of Open Source Software, 3(21), 550. https://doi.org/10.21105/joss.00550
Landau, W. M. (2021). The targets R package: A dynamic make-like function-oriented pipeline toolkit for reproducibility and high-performance computing. Journal of Open Source Software, 6(57), 2959. https://doi.org/10.21105/joss.02959
Sandve, G. K., Nekrutenko, A., Taylor, J., & Hovig, E. (2013). Ten simple rules for reproducible computational research. PLOS Computational Biology, 9(10), e1003285. https://doi.org/10.1371/journal.pcbi.1003285
Wilson, G., Aruliah, D. A., Brown, C. T., Chue Hong, N. P., Davis, M., Guy, R. T., Haddock, S. H. D., Huff, K. D., Mitchell, I. M., Plumbley, M. D., Waugh, B., White, E. P., & Wilson, P. (2014). Best practices for scientific computing. PLOS Biology, 12(1), e1001745. https://doi.org/10.1371/journal.pbio.1001745
Wilson, G., Bryan, J., Cranston, K., Kitzes, J., Nederbragt, L., & Teal, T. K. (2017). Good enough practices in scientific computing. PLOS Computational Biology, 13(6), e1005510. https://doi.org/10.1371/journal.pcbi.1005510